[PRESS RELEASE] Ipsos Survey: Indonesia’s Consumer Confidence Declines in March 2026, Driven by Concerns Over Future Economic Conditions
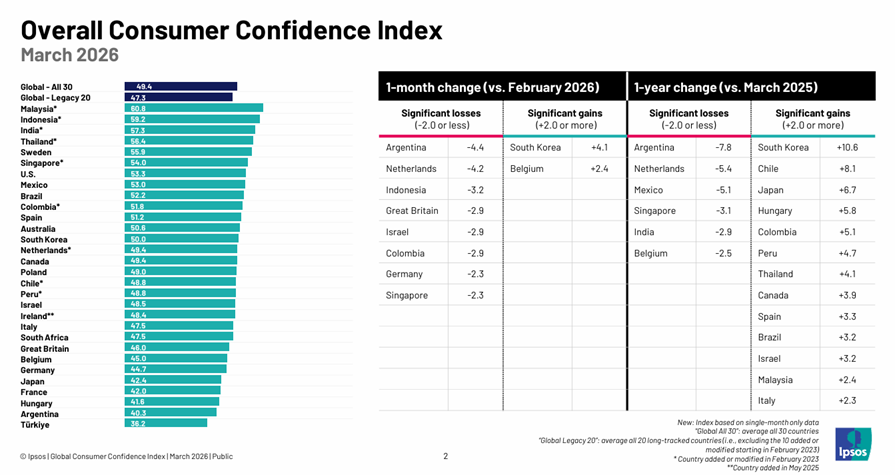
Jakarta, 10 April, 2026 — Ipsos has released the latest results of the Global Consumer Confidence Index (GCCI), indicating a decline in consumer confidence in Indonesia in March 2026. The national index dropped to 59.2, down from 62.4 in February and 62.6 in January 2026.
This decline reflects growing caution among Indonesian consumers amid ongoing global dynamics and economic uncertainty. Globally, consumer confidence has also declined for the first time in nearly a year, with the global index standing at 49.4.
Indonesia Still in a Cautious Position
Despite the decline, Indonesia remains above the optimism threshold (50 points), indicating that consumers generally still maintain a relatively positive outlook, while becoming more cautious about future economic conditions.
Among the 30 countries surveyed, Malaysia (60.8) is the only country scoring above 60. Meanwhile, Indonesia (59.2) is among 12 countries that remain above the 50-point mark, alongside countries such as India and Thailand.
“Indonesia Consumer Confidence Index is at a critical juncture. The drop in Index is reflected across all four components—Current Situation, Expectations, Investment, and Jobs—signals rising caution among Indonesian consumers. Yet, remaining above the optimism threshold of 50 demonstrates resilience and continued confidence in the nation’s economic fundamentals,” said Hansal Savla, Managing Director of Ipsos Indonesia.
Declines Across All Components
The GCCI is composed of four key components, and in March 2026, Indonesia recorded declines across all of them:
- Current Situation (-2.5)
Perceptions of current personal financial conditions and the local economy - Expectations (-5.1)
Outlook on future financial conditions, the economy, and employment - Investment (-2.9)
Confidence in making purchases and investments - Jobs (-2.3)
Perceptions of job security and employment opportunities
1-month change | ||||||||||||||||
Current | Expectations | Investment | Jobs | |||||||||||||
Current personal financial situation, local economy, employment | Expected future personal financial situation, local economy, employment | Purchasing and investment confidence, personal financial situation and outlook | Job security confidence, job loss experience, employment outlook | |||||||||||||
Significant losses (-2.0 or less) | Significant gains (+2.0 or more) | Significant losses (-2.0 or less) | Significant gains (+2.0 or more) | Significant losses (-2.0 or less) | Significant gains (+2.0 or more) | Significant losses (-2.0 or less) | Significant gains (+2.0 or more) | |||||||||
Argentina | -6.1 | South Korea | +5.4 | Indonesia | -5.1 | India | +5.8 | Netherlands | -5.5 | South Korea | +4.8 | Argentina | -4.1 | India | +5.0 | |
Netherlands | -5.3 | Belgium | +3.1 | Netherlands | -4.4 | South Korea | +4.2 | Argentina | -4.9 | Belgium | +3.1 | Germany | -3.9 | U.S. | +4.2 | |
Colombia | -5.1 | Canada | +2.4 | Argentina | -3.0 | Hungary | +2.8 | Colombia | -4.1 | Canada | +2.9 | Chile | -3.6 | Japan | +3.0 | |
Great Britain | -3.9 | Spain | +2.1 | Israel | -2.4 | South Africa | +2.3 | Great Britain | -4.0 |
|
| Singapore | -3.2 | Türkiye | +2.4 | |
South Africa | -3.0 |
|
| Australia | -2.2 |
|
| Israel | -3.3 |
|
| Colombia | -3.1 | Belgium | +2.1 | |
Israel | -2.7 |
|
| Singapore | -2.1 |
|
| Indonesia | -2.9 |
|
| Australia | -3.0 | South Korea | +2.1 | |
Indonesia | -2.5 |
|
|
|
|
|
| South Africa | -2.8 |
|
| Great Britain | -2.8 |
|
| |
Singapore | -2.5 |
|
|
|
|
|
| U.S. | -2.7 |
|
| Indonesia | -2.3 |
|
| |
U.S. | -2.2 |
|
|
|
|
|
| Singapore | -2.6 |
|
| Israel | -2.2 |
|
| |
Chile | -2.1 |
|
|
|
|
|
| Germany | -2.0 |
|
|
|
|
|
| |
Germany | -2.1 |
|
|
|
|
|
| India | -2.0 |
|
|
|
|
|
| |
|
|
|
|
|
|
|
|
|
|
|
|
|
|
|
| |
|
|
|
|
|
|
|
|
|
|
|
|
|
|
|
| |
|
|
|
|
|
|
|
|
|
|
|
|
|
|
|
| |
|
|
|
|
|
|
|
|
|
|
|
|
|
|
|
| |
|
|
|
|
|
|
|
|
|
|
|
|
|
|
|
| |
|
|
|
|
|
|
|
|
|
|
|
|
|
|
|
| |
|
|
|
|
|
|
|
|
|
|
|
|
|
|
|
| |
|
|
|
|
|
|
|
|
|
|
|
|
|
|
|
| |
The most significant decline occurred in the Expectations component, indicating growing consumer concerns about future economic conditions.
However, the decline in consumer confidence is not unique to Indonesia. This trend is also observed across the Asia-Pacific region, where several countries, including Singapore, have experienced similar declines. This situation is partly driven by ongoing global geopolitical dynamics, which continue to shape public perceptions of the economy.
About the Study
These findings are based on data from a monthly 30-country survey conducted by Ipsos on its Global Advisor online survey platform and, in India, on its IndiaBus platform. They are first reported each month by LSEG as the Primary Consumer Sentiment Index (PCSI).
The results are based on interviews with over 21,700 adults aged 18+ in India, 18-74 in Canada, Ireland, Israel, Malaysia, South Africa, Turkey, and the United States, 20-74 in Thailand, 21-74 in Indonesia and Singapore, and 16-74 in all other countries.
The monthly sample consists of 1,000+ individuals each in Australia, Brazil, Canada, France, Germany, Great Britain, Italy, Japan, Spain, and the U.S., and 500+ individuals in each of Argentina, Belgium, Chile, Colombia, Hungary, Indonesia, Ireland, Israel, Malaysia, Mexico, the Netherlands, Peru, Poland, Singapore, South Africa, South Korea, Sweden, Thailand, and Türkiye. The sample in India consists of approximately 2,200 individuals of whom 1,800 were interviewed face-to-face and 400 were interviewed online.
Samples in Argentina, Australia, Belgium, Canada, France, Germany, Great Britain, Hungary, Italy, Japan, the Netherlands, Poland, South Korea, Spain, Sweden, and the U.S. can be considered representative of their general adult populations under the age of 75. Samples in Brazil, Chile, Colombia, Indonesia, Israel, Ireland, Malaysia, Mexico, Peru, Singapore, South Africa, Thailand, and Türkiye are more urban, more educated, and/or more affluent than the general population. The survey results for these countries should be viewed as reflecting the views of the more “connected” segment of their populations. India’s sample represents a large subset of its urban population — social economic classes A/B/C in metros and tier 1-3 town classes across all four zones.
The data is weighted so that the composition of the sample in each country best reflects the demographic profile of the adult population according to the most recent census data.
The global indices and averages reported here reflect the average result for all the countries and markets in which the survey was conducted. They have not been adjusted to the population size of each country or market and are not intended to suggest “total” results.
Sample surveys and polls may be subject to other sources of error, including, but not limited to coverage error and measurement error. The precision of Ipsos online surveys is calculated using a Bayesian credibility interval with a survey of N=1,000 being accurate to +/- 3.5 percentage points and a survey of N=500 being accurate to +/- 5.0 percentage points. For more information on credibility intervals, visit this page.
For the Global Index, significant changes are +/- 0.5 point. For individual countries, significant changes are +/- 2.0 points.
The LSEG/Ipsos Primary Consumer Sentiment Index (PCSI), ongoing since 2010, is a monthly survey of consumer attitudes on the current and future state of their local economy, personal financial situation, savings, and confidence to make major investments. The PCSI metrics reported each month for each of the countries surveyed consist of a “Primary Index” based on all 10 questions below and of several “sub-indices” each based on a subset of these 10 questions.
The publication of these findings abides by local rules and regulations.