The Perils of Perception: Canadians Fail on Every Perception versus Fact about their Country in Unique Socio-demographic Knowledge Test
Toronto- A new Ipsos Reid global survey highlights how wrong the public across 14 countries are about the basic make-up of their populations with Canada clocking in at eight (8th) out of 14 for accuracy (seventh out of 14 for ignorance).
Of all of the socio-demographic facts guestimated, Canadians got all of them either wrong or without a majority finding the given fact to be true. Simply put, the perceptions of their country on these nine measures versus the realities just don't add up--and that can cause many societal issues in what the public surmises or advocates on various topics or issues.
For the countries surveyed, Ipsos Reid asked respondents to guestimate nine certain verifiable facts as a percentage or as a true or false statement and then compared the perception of the population to the reality. For Canada, all facts are from Statistics Canada data. The survey was done Online using the Ipsos international respondent panel system. Rankings of the countries were then performed based on levels of accuracy to the verified facts versus the perceptions of each country population.
The countries measured were Australia, Belgium, Canada, France, Germany, Great Britain, Hungary, Italy, Japan, Poland, South Korea, Spain, Sweden, and the United States.
Residents from each country surveyed, including Canada, can take their own interactive test at:
https://www.ipsos-mori.com/_assets/perceptionsquiz/index.html
The Country Accuracy Rankings: Perceptions versus Realities...
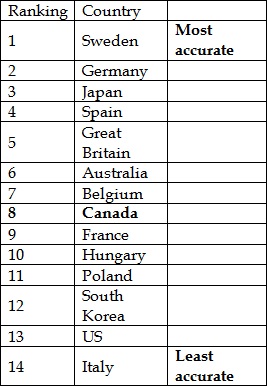
In Canada we get all of them wrong or without a majority finding a given fact true...
Of all of the facts guestimated, Canadians got all of them either wrong or without a majority finding the given fact true.
- Ageing population: we over-estimate the Canadian population as much older than it actually is -- the average estimate is that 39.2% of the population is 65+, when it is in fact only 14% -- a perception gap of -25.2 points.
- Christians: we underestimate the proportion of Christians -- Canadians think half (48.5%) of the country identify themselves as Christian compared with the actual figure of 69% --a perception gap of -20.5 points.
- Muslims: we hugely over-estimate the proportion of Muslims in Canada -- we think one in five Canadian people are Muslims (20.2%) when the actual figure is 2% -- a perception gap of -18.5 points.
- Unemployment: Canadians over-estimate that nearly 22.7% of the working age population is unemployed when the actual figure is much lower at 7% -- a perception gap of -15.7 points.
- Murder rates: Canadians are however one of the best informed countries on the murder rate: 47% saying it is falling (which is correct), and only 33% think it is rising (which is incorrect) while 20% say they don't know--a perception gap of -14 points.
- Teenage pregnancy: Canadians over-estimate that one in six (15.4%) of all teenage girls aged 15-19 give birth each year, when the actual figure is only 1.3% -- a perception gap of -14.1 points.
- Immigration: Canadians over-estimate that 34.6% of the population are immigrants while the real figure is 21% -- a perception gap of -13.6 points. *
- Voting: Canadians underestimate the proportion of the electorate that voted in the last general election -- the average guess is 50.9% when the official turnout was much higher at 61% -- a perception gap of -10.1 points.
- Life expectancy: Canadians underestimate our life expectancy thinking the average for a child born in 2014 will be 80.3 years, when the actual estimate is 82 years-- a perception gap of -1.7 points.
But the rest of the world is just as wrong...
- Ageing population: people think the population is much older than it actually is -- the average estimate is that 39% of the population is 65+, when only 18% are. Italians are particularly wrong on this -- on average, they think nearly half the population (48%) are 65+, when it is actually 21%.
- Christians: in contrast, majority-Christian countries tend to underestimate how many people count themselves as Christian. In the 12 majority-Christian countries in the survey, the average guess is 51%, when the actual proportion counting themselves as Christians is 61%. This includes countries like the US where people think 56% are Christian when official data shows it is 78%.
- Muslims: people across just about all countries hugely overestimate the proportion of their population that are Muslim: the average guess across the countries is 16% when the actual proportion is 3%. For example, on average people in France think 31% of the population is Muslim, when the actual figure is only 8%. In Australia the average guess is nine times the actual proportion: people estimate it at 18%, when the actual proportion is only 2%.
- Unemployment: people tend to greatly overestimate the extent of unemployment in their countries. The average guess is 30%, when the actual figure is 9%. This includes some huge overestimates, for example in Italy, where the average guess is that 49% are unemployed, compared with an actual rate of 12%.
- Murder rates: 49% of people across the countries think that the murder rate is rising and only 27% think it is falling -- when in fact in all countries in the study, the murder rate is actually falling. The British are the most likely to have an accurate view of murder rate trends: 49% think it's falling and only 25% think it's rising.
- Teenage birth rates: on average, people across the 14 countries think that 15% of teenagers aged 15-19 give birth each year. This is 12 times higher than the average official estimate of 1.2% across these countries. People in the US guess at a particularly high rate of teenage births, estimating it at 24% of all girls aged 15-19 when it's actually 3%. But other countries with very low rates of teenage births are further out proportionally: for example, Germans think that 14% of teenage girls give birth each year when it's actually only 0.4% (35x the actual figure).
- Immigration: across the 14 countries, the public think immigration is over twice the actual level -- the average guess is that 24% of the population was born abroad, when the actual figure is 11%. This includes some massive overestimates: the US public think 32% of the population are immigrants when the actual is 13%; in Italy the public think 30% are immigrants when it's actually 7%; and in Belgium the public think it's 29% when it's actually 10%.
- Voting: every country in the study underestimates the proportion of the electorate who voted in their last major election. The average guess is that 58% voted, when in fact 72% did. The French in particular are too pessimistic about the extent of democratic engagement: estimating that only 57% of the electorate voted in the Presidential election, when in fact 80% did.
- Life expectancy: this is one area where on average we have a much better grasp of reality. Across the 14 countries, the average life expectancy for a child born this year is estimated to be 80 years, when across these countries as a whole it's actually 81 years. However, there is still a wide range between countries: people in South Korea are too optimistic, expecting the average life expectancy to be 89 years, compared with an actual of 80 years; but Hungarians are too pessimistic, only expecting 68 years, when the average is predicted to be 75 years.
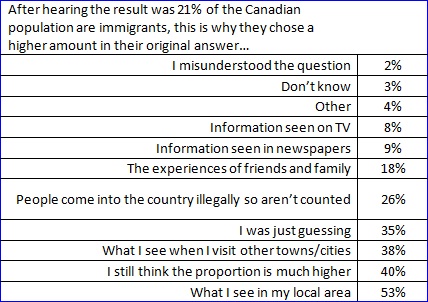
* For those who indicated that the result was higher than the actual 21% result of immigrants in Canada, they were then told the real percentage and then asked to elaborate as to why they made their initial choice (this was the only question in the survey which asked a follow-up in this manner). The results were as follows:
These are the findings of the Perils of Perception Survey conducted by Ipsos. The lead office for the survey was Ipsos in London. The Canadian portion was overseen by Ipsos Reid. A total of 11,527 interviews were conducted between conducted between August 12th and August 26th 2014. The survey was conducted in 14 countries around the world via the Ipsos Online Panel system in Australia, Belgium, Canada, France, Germany, Hungary, Italy, Japan, Poland, South Korea, Spain, Sweden, Great Britain and the United States of America. In the US and Canada respondents are aged 18-64, and 16-64 in all other countries. Approximately 1000+ individuals were surveyed in Australia, Canada, France, Germany, Italy, Japan, Spain, Great Britain and the United States of America. Approximately 500+ individuals were surveyed in the remaining countries. Where results do not sum to 100, this may be due to computer rounding, multiple responses or the exclusion of don't knows or not stated responses. Data are weighted to match the profile of the population. The precision of Ipsos online polls are calculated using a credibility interval. In this case, a poll of 1,000 is accurate to ± 3.5 percentage points and one of 500 is accurate to ± 5.0 percentage points in their respective general populations. There are 15 countries that have been weighted to represent their actual adult population: Argentina, Australia, Belgium, Canada, France, Germany, Hungary, Italy, Japan, Poland, South Korea, Spain, Sweden, United Kingdom and the United States. The remaining nine country results are representative of adult Primary Consumers who are internet enabled and have a higher income and education than the average country norm.
For more information on this news release, please contact:
John Wright
Senior Vice President
Ipsos Reid
Public Affairs
(416) 324-2002
[email protected]
Technical Notes...
The ranking for each country was calculated as follows:
For each item that were measured as percentages (a number out of 100): an accuracy score for each country was calculated as the difference between the mean of the survey estimate and the actual value. The accuracy score was then `standardized' (adjusted) to acknowledge that a difference for a small (or large) prevalence should be treated differently to the same-sized difference around a prevalence nearer 50%: for example, a difference between 5% and 10% would be considered to be of lower accuracy compared with a difference between 45% and 50%. This standardization was done by calculating the equivalent accuracy score around an estimate of 50% for each country. For example, for a accuracy score of 5% between 5% and 10%, the standardized accuracy score around an estimate of 50% was calculated to be 9.5% (i.e. the difference between 45.25% and 54.75%). The countries were then ranked based on the standardized accuracy score.
For the measure of average life expectancy, the countries were ranked on the raw accuracy score -- no standardization was carried out. This is because average life expectancy is a discrete measure rather than a percentage.
For the indicator of whether the murder rate was rising or not, the countries were ranked in order of the proportion of respondents in that country that reported that the rate was rising. In all the countries the rate is actually falling so, the lower the proportion of respondent in the country that reported it was rising, the more accurate the perception. (Whether the murder rate is rising or falling was classified as `unclear' in South Korea. As it is falling for all the other countries, we assumed it was also falling in South Korea).
Each country was ranked for each item as described above: 1 for the most accurate through to 14 for the least accurate perception. The individual ranks for the items were then added to together for each country. This sum of the ranks was then used to rank the countries over all the measures: the country with the lowest sum of the ranks having the most accurate perception overall and hence being ranked 1.
The Standardization Approach
Mean survey measure = Ps
Actual measure = Pa
Accuracy score = | Ps -- Pa |
Mid-point of measures = Pm = ( Ps + Pa ) / 2
Spread around mid-point of measures (sdm) = v(P_mЧ(100-P_m))
Spread around 50% (sd50%) = v(50Ч(100-50)) = 50
Standardized accuracy score = | Ps -- Pa | x ( sd50% / sdm ) = | Ps -- Pa | x ( 50 / sdm )
Note to Editors:
For further International (non-specific country) information, please contact Hannah Millard at 02073473452, Ipsos, London, Great Britain [email protected]
About Ipsos Reid
Ipsos Reid is Canada's market intelligence leader and the country's leading provider of public opinion research. With operations in eight cities, Ipsos Reid employs more than 600 research professionals and support staff in Canada. The company has the biggest network of telephone call centres in Canada, as well as the largest pre-recruited household and on-line panels. Ipsos Reid's Canadian marketing research and public affairs practices are staffed with seasoned research consultants with extensive industry-specific backgrounds, offering the premier suite of research vehicles in Canada--all of which provide clients with actionable and relevant information. Ipsos Reid is an Ipsos company, a leading global survey-based market research group. To learn more, visit www.ipsos.ca
About Ipsos
Ipsos is an independent market research company controlled and managed by research professionals. Founded in France in 1975, Ipsos has grown into a worldwide research group with a strong presence in all key markets. Ipsos ranks third in the global research industry.
With offices in 86 countries, Ipsos delivers insightful expertise across six research specializations: advertising, customer loyalty, marketing, media, public affairs research, and survey management.
Ipsos researchers assess market potential and interpret market trends. They develop and build brands. They help clients build long-term relationships with their customers. They test advertising and study audience responses to various media and they measure public opinion around the globe.
Ipsos has been listed on the Paris Stock Exchange since 1999 and generated global revenues of e1,712,4 million (2 274 M$) in 2013.
Visit www.ipsos.com to learn more about Ipsos' offerings and capabilities.