
国際女性デー調査:2026年のジェンダー平等に対する世界的な意識
29か国を対象とした最新のイプソス国際女性デー報告書では、ジェンダー平等の取り組みが十分に進んだと考える人がわずかながら過半数に達していることが示されています。
国際女性デー(2026年3月8日)に向け、キングス・カレッジ・ロンドンのグローバル女性リーダーシップ研究所と共同で実施された本調査では、特に若い世代の男女間で、いくつかの課題について依然として大きな隔たりが存在することが判明しました。
主な調査結果―グローバル
男女平等は十分に進んだと考える人の割合が2019年から増加
男女の平等な権利付与に関して、自国では十分に進んだと考える人がわずかながら過半数(29か国平均52%)を占めました。本年と2019年の調査の両方に参加した24か国のうち、23か国で「十分に進みすぎている」と考える人が増加しています。
男性の過半数が、既に平等実現のために過剰な負担を負っていると認識
29か国全体の男性の54%が「過剰な負担」と感じているのに対し、女性は38%でした。多くの国で、この問題に関する男女の認識に大きな差が見られます。
男性の2人に1人は、平等推進の動きが男性を差別していると考えている
平均で52%の男性が「女性の平等推進が過度に進み、男性が差別されている」と同意しています。同じように感じている女性はわずか36%です。
しかし、より多くの女性が指導的立場に立つことで状況が改善されるとの確固たる信念がある
60%の人が、政府や企業で責任ある役職に就く女性が増えれば、物事がより円滑に進むと同意しています。反対意見はわずか27%でした。女性の68%、男性の53%がこのように考えています。
将来への楽観視は若い女性の方が若い男性より強い
自国における現代の若い女性は、親の世代の女性よりも良い生活を送れると考える人は55%でした。一方、若い男性が親の世代の男性よりも良い生活を送れると考える人は40%にとどまりました。
自己表現の選択肢は女性に多く見られるが、職業選択の自由は男性に多く見られる
服装の選択(34%)、交際(24%)、家庭内での役割(22%)については、男性よりも女性に選択肢が多いと見なされる傾向があります。一方、就労の選択肢(39%)については、女性よりも男性に選択肢が多いと見なされる傾向があります。
主な調査結果―日本
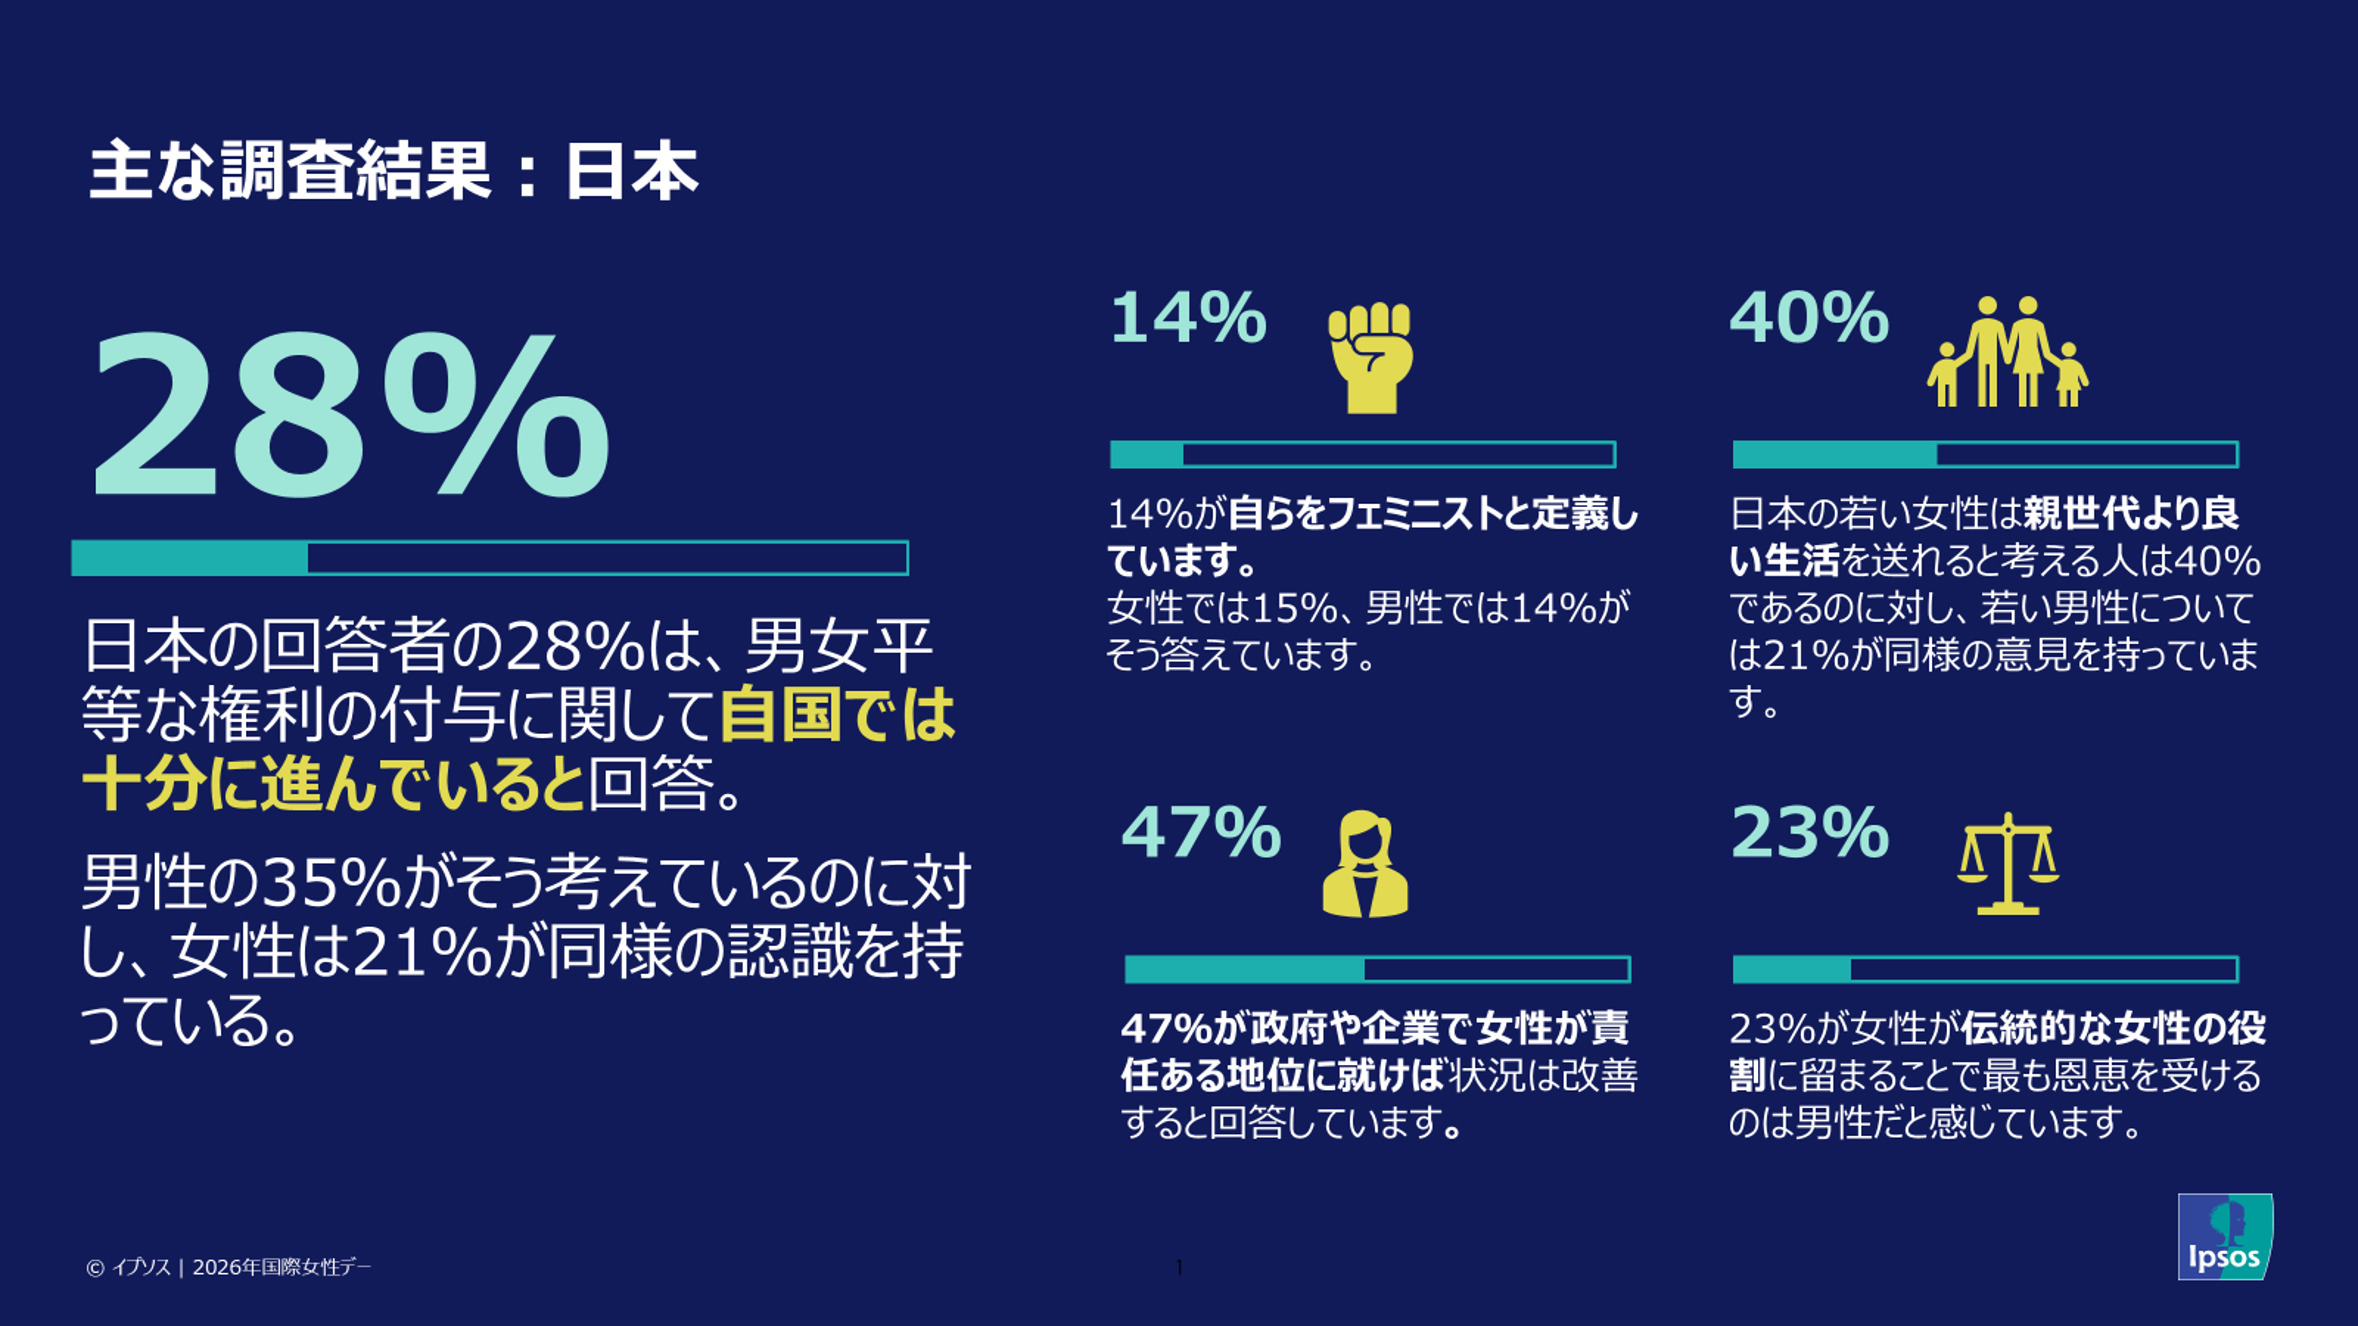
「男女平等が十分に進んだ」と考える割合は28%で世界最下位
自国における男女平等な権利の付与について、「十分に進んでいる」と回答した日本の回答者はわずか28%で、調査対象国の中で最下位となりました。また、男性の35%がそう考えているのに対し、女性は21%にとどまり、国内でも男女間で認識の差が見られます。
女性のリーダーシップによる状況改善への期待は47%
「政府や企業で女性が責任ある地位に就けば状況は改善する」と回答した人は47%でした。グローバル平均(60%)と比較するとやや低いものの、約半数が女性リーダーの増加に期待を寄せています。
将来への楽観視はグローバル同様、女性が男性を上回る
「若い女性は親世代より良い生活を送れる」と考える人は40%。一方、「若い男性が親世代より良い生活を送れる」と考える人は21%にとどまり、日本でも若い女性の未来に対する見方の方が明るい結果となりました。
伝統的な役割分担に関する認識
23%が「女性が伝統的な女性の役割に留まることで最も恩恵を受けるのは男性だ」と感じています。
自らを「フェミニスト」と定義する人は14%
自らをフェミニストであると定義した人は全体の14%でした(女性15%、男性14%)。

イプソス国際女性デー2026 の調査レポートをダウンロード
ダウンロードするMethodology
Report presents the results of a 29-country survey conducted by Ipsos on its Global Advisor online platform and, in India, on its IndiaBus platform, between Wednesday, December 24, 2025 and Friday, January 9, 2026. For this survey, Ipsos interviewed a total of 23,268 adults aged 18 years and older in India, 18-74 in Canada, Republic of Ireland, Malaysia, South Africa, Türkiye, and the United States, 20-74 in Thailand, 21-74 in Indonesia and Singapore, and 16-74 in all other countries.
The sample consists of approximately 2,000 individuals in Japan, 1,000 individuals each in Australia, Belgium, Brazil, Canada, France, Germany, Great Britain, Italy, Mexico, Spain, and the U.S., and 500 individuals each in Argentina, Chile, Colombia, Hungary, Indonesia, Ireland, Malaysia, the Netherlands, Peru, Poland, Singapore, South Africa, South Korea, Sweden, Thailand, and Türkiye. The sample in India consists of approximately 2,200 individuals, of whom approximately 1,800 were interviewed face-to-face and 400 were interviewed online.
Samples in Argentina, Australia, Belgium, Canada, France, Germany, Great Britain, Hungary, Italy, Japan, the Netherlands, Poland, South Korea, Spain, Sweden, and the U.S. can be considered representative of their general adult populations under the age of 75. Samples in Brazil, Chile, Colombia, Indonesia, Ireland, Malaysia, Mexico, Peru, Singapore, Saudi Arabia, South Africa, Thailand, and Türkiye are more urban, more educated, and/or more affluent than the general population. The survey results for these countries should be viewed as reflecting the views of the more “connected” segment of their population.
India’s sample represents a large subset of its urban population — social economic classes A, B and C in metros and tier 1-3 town classes across all four zones.
The data is weighted so that the composition of each country’s sample best reflects the demographic profile of the adult population according to the most recent census data. In Great Britain, the data was weighted by age, gender, and education. “The Global Country Average” reflects the average result for all the countries and markets in which the survey was conducted. It has not been adjusted to the population size of each country or market and is not intended to suggest a total result.
When percentages do not sum up to 100 or the ‘difference’ appears to be +/-1 percentage point more/less than the actual result, this may be due to rounding, multiple responses, or the exclusion of “don't know” or not stated responses.
The precision of Ipsos online polls is calculated using a credibility interval with a poll where N=1,000 being accurate to +/- 3.5 percentage points and of where N=500 being accurate to +/- 5.0 percentage points. For more information on Ipsos' use of credibility intervals, please visit click here.