Key metros remain battlegrounds ahead of the November Local Government Elections
The political landscape remains highly competitive. Helen Zille has been campaigning for months and has drawn considerable attention with her unusual and eye-catching campaign in Johannesburg, while other parties have been slower off the mark. Some parties have now announced their mayoral candidates for the eight major metropolitan municipalities, but the ANC, after indicating that mayoral candidates would be announced ahead of its manifesto launch, has thus far only published a list of 42 potential candidates.
Ipsos conducted its regular Khayabus “Pulse of the People” study during this period of pre-election uncertainty and speculation. Between June and July 2026, 3 600 randomly selected South Africans were interviewed in their homes and home languages. The study is designed to provide insight into the views of South Africans from all provinces, settlement types and backgrounds. Results are weighted and projected to the population of South Africans aged 18 years and older who are eligible to vote.
With election day now only two months away, it is an appropriate time to take stock of the current electoral landscape. However, the figures quoted in this press release should not be interpreted as a prediction of the final election outcome. There is still much campaigning to do, many voters to persuade and many arguments to have before South Africans cast their ballots on 4 November 2026.
Understanding the electorate
When asked, 70% of respondents indicated that they were registered as voters with the IEC1. The analysis in this press release focuses on the views and voting intentions of this group.
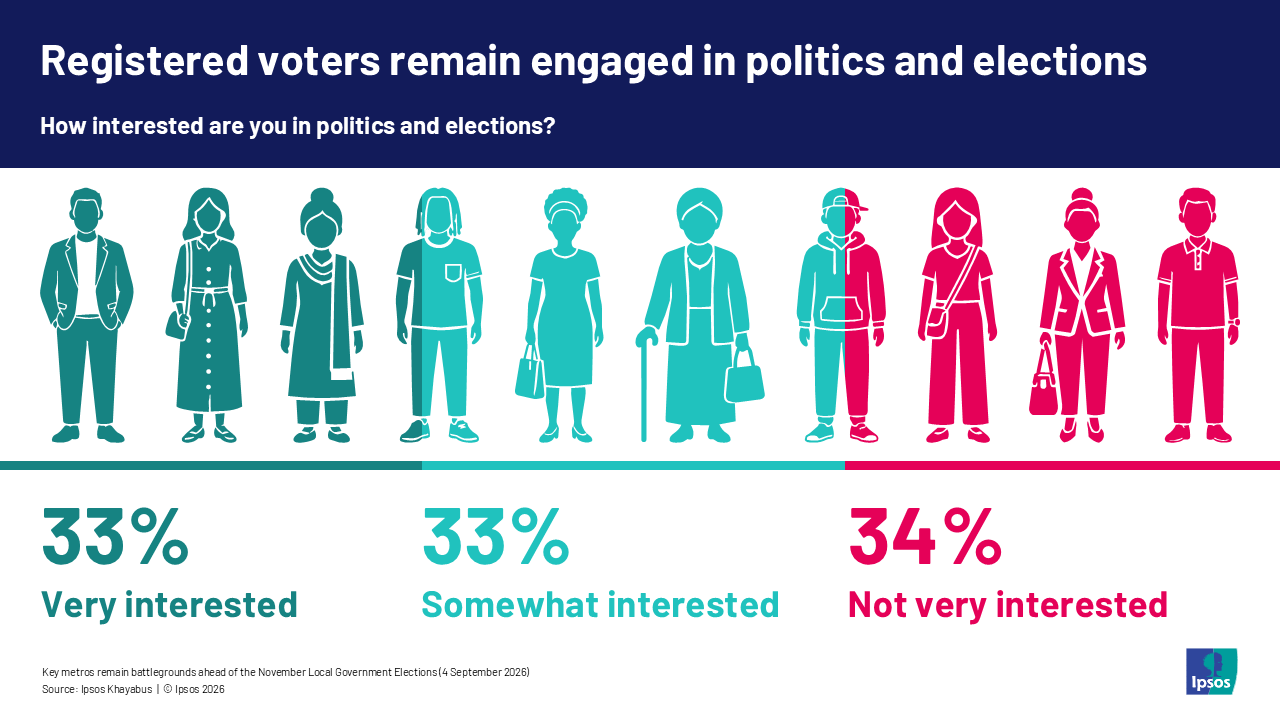
While public debate often focuses on party support, voter interest and turnout remain equally important factors in determining election outcomes. Among registered voters, two-thirds expressed either some interest or said that they are very interested in politics and elections.
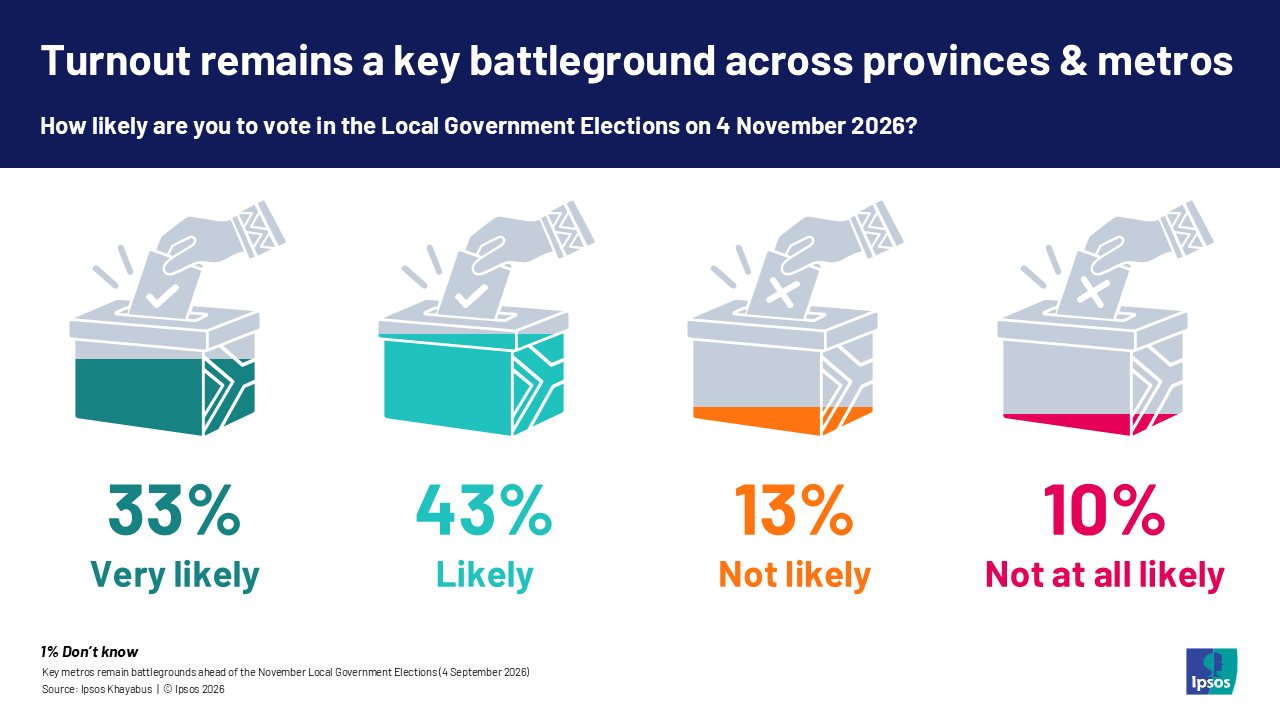
Interest in politics does not always translate into participation on election day. However, when asked how likely they were to vote in the upcoming Local Government Elections, about three-quarters of registered voters indicated that they were either likely or very likely to cast their ballots.
However, the picture becomes more nuanced when respondents are asked to make an actual party choice.
Registered voters were presented with an electronic ballot paper and asked to indicate their preferred political party themselves2.
Several respondents decided not to answer this question and/or indicated that they would not vote in the Local Government Elections. These potential stay-away voters are important to consider, particularly as their proportions differ markedly across provinces and metropolitan municipalities.
For political parties, these represent voters who may still be persuaded to participate. With two months of campaigning remaining, turnout could prove just as important as party support in determining election outcomes.
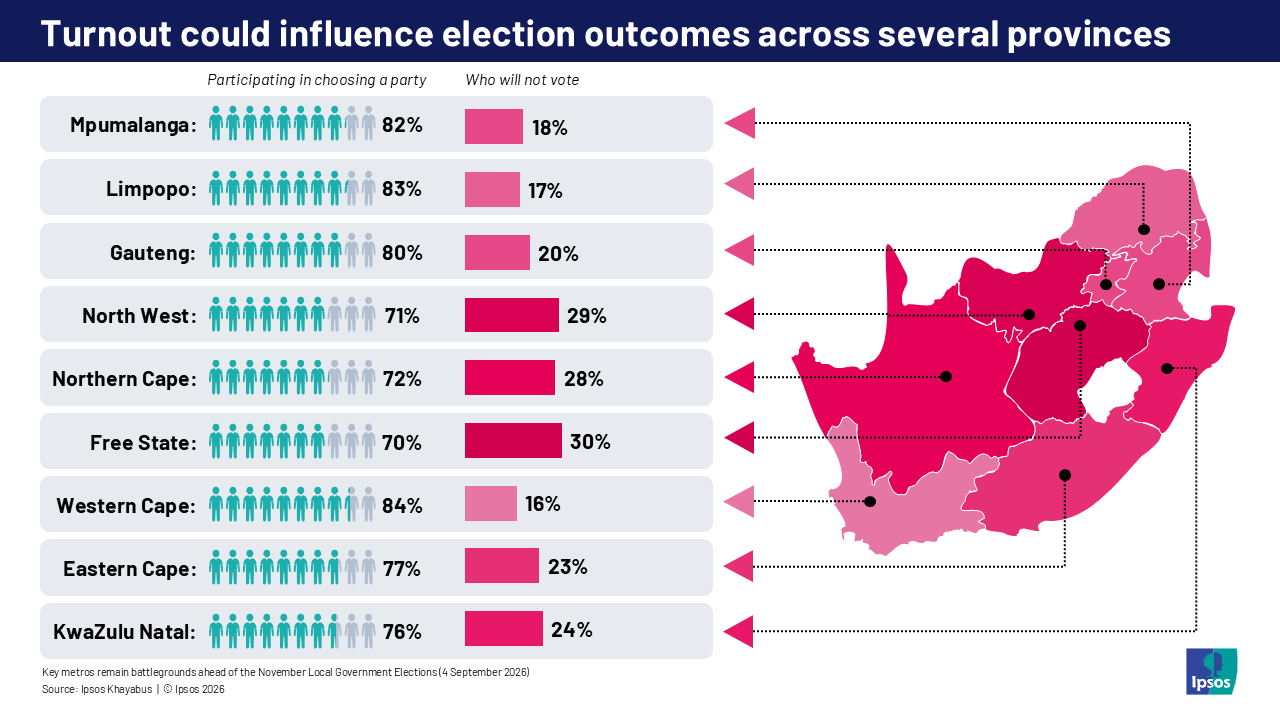
The table below shows the proportion of registered voters in each province who selected a political party (or indicated that they do not yet know who to support), compared with those who indicated that they would not vote in the Local Government Elections.
The findings suggest that turnout could play a significant role in determining election outcomes in several provinces. Registered voters in the Western Cape (84%) and Limpopo (83%) appear most likely to participate, while between one-quarter and three in every ten registered voters in KwaZulu-Natal, the Northern Cape, North West and the Free State currently indicate that they do not intend to vote.
As campaigning intensifies over the next two months, some of the fiercest contestations are likely to take place in the country's metropolitan municipalities.
The proportions of registered voters who currently indicate that they will not vote in the Local Government Elections are therefore particularly relevant to prospective councillors and political parties.
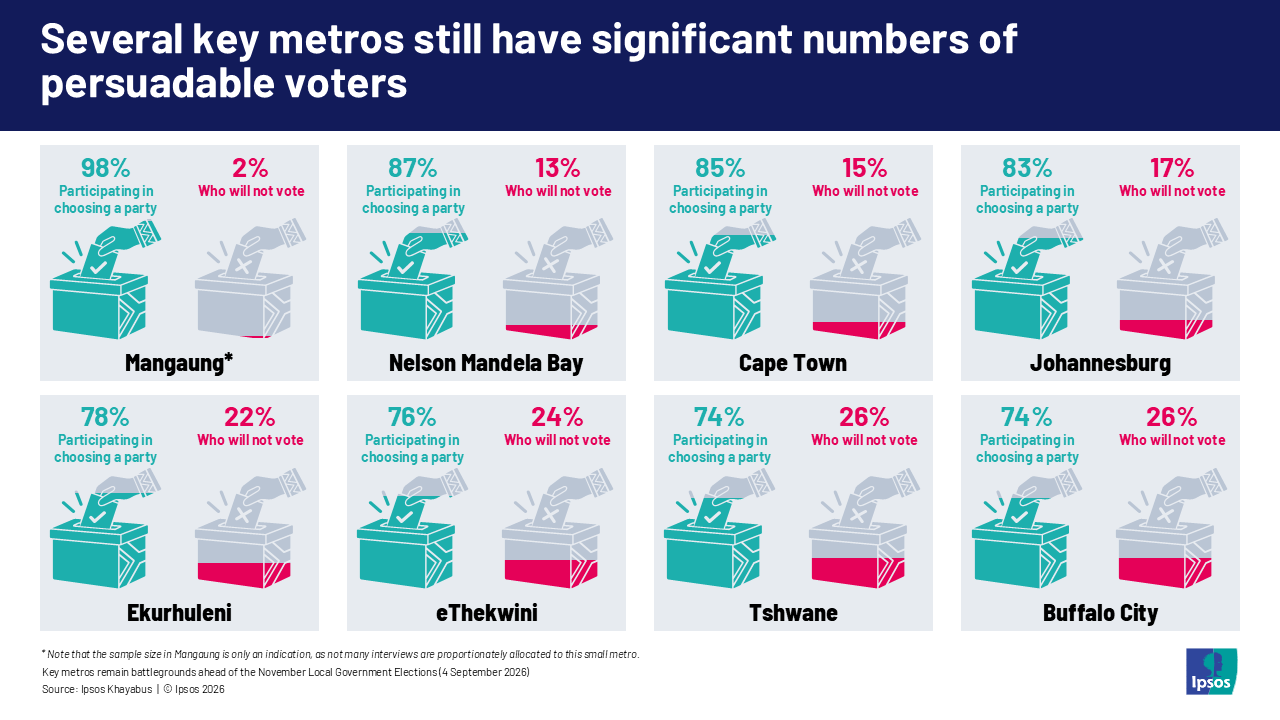
These findings may be of particular interest to political parties campaigning in Ekurhuleni, eThekwini, Tshwane and Buffalo City. In each of these metros, between roughly one-fifth and one-quarter of registered voters currently indicate that they do not intend to vote. Mobilising even a portion of these voters could significantly influence electoral outcomes in closely contested municipalities.
Current political party support
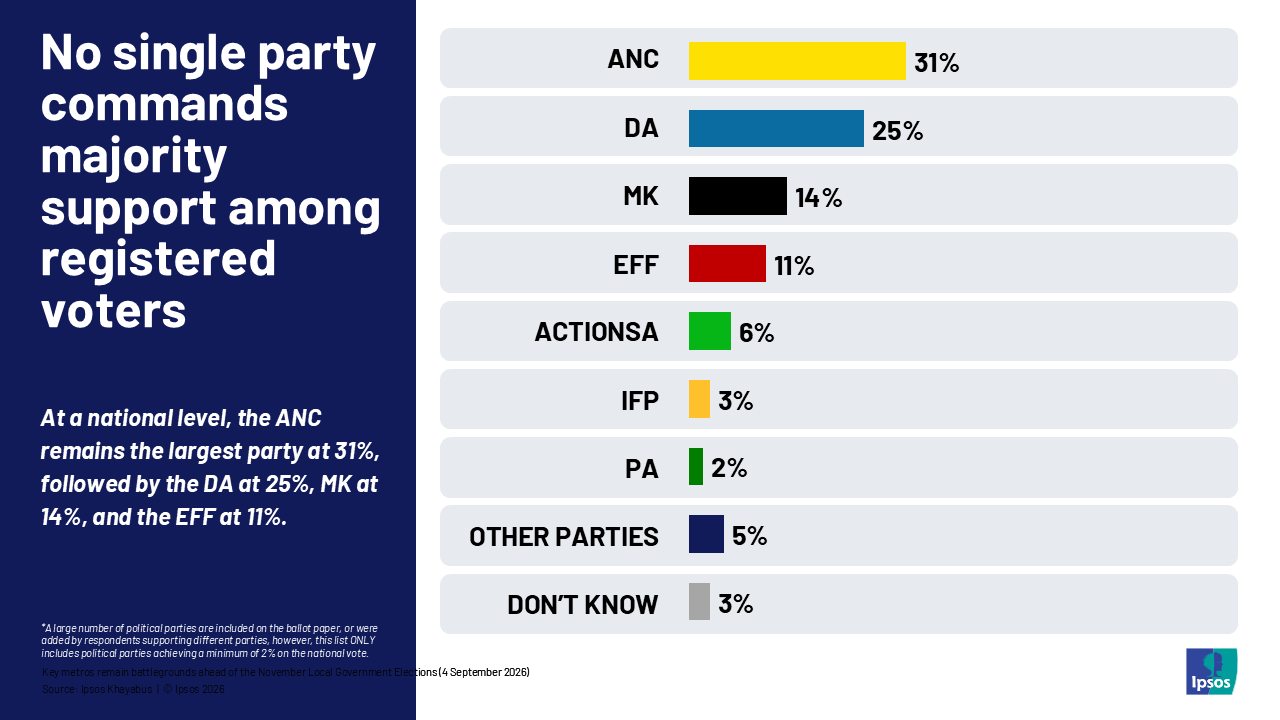
The figures below reflect current levels of support for political parties among registered voters who selected a political party on the electronic ballot paper. The results are based on the choices of 81.8% of registered voters. Party support figures have been recalculated to total 100% among those who expressed a voting preference.
As with previous elections, political support varies considerably across provinces, highlighting the regional strengths and weaknesses of South Africa’s major political parties3:
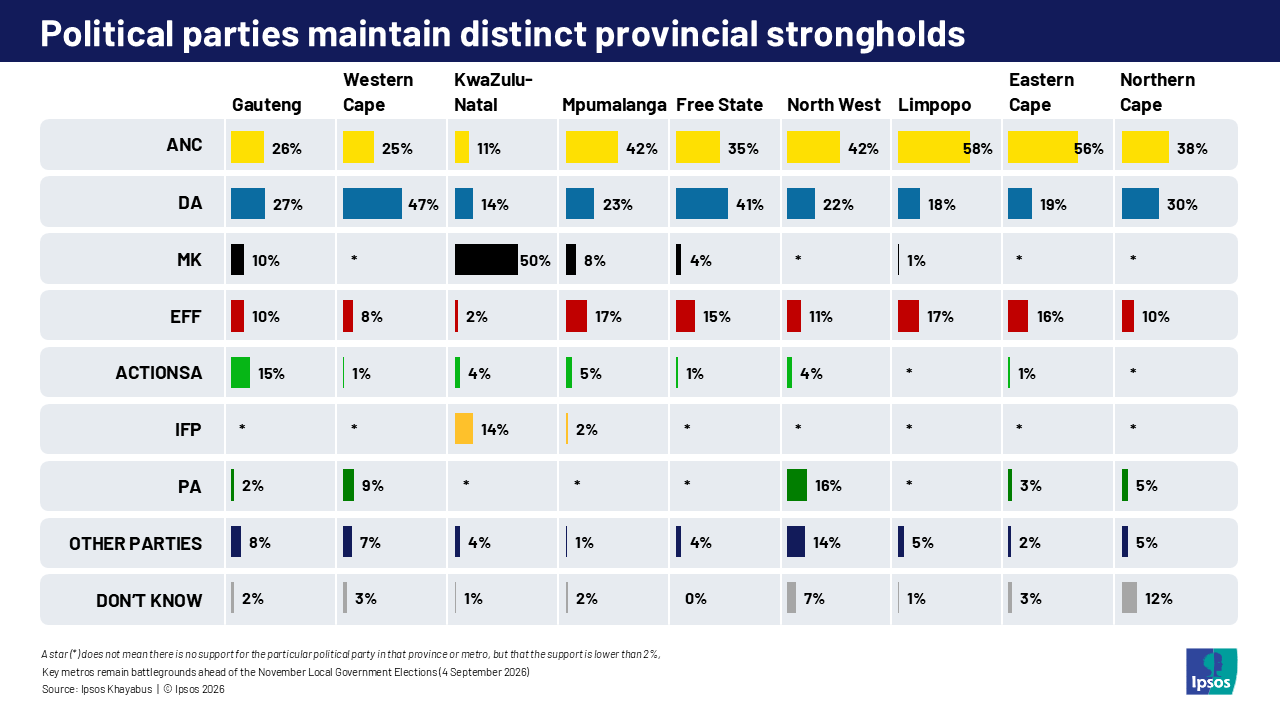
While Local Government Elections do not determine provincial governments, the findings provide valuable insight into the relative strength of parties across the country.
The ANC continues to enjoy particularly strong support in Limpopo and the Eastern Cape, while the DA remains dominant in the Western Cape and performs competitively in several other provinces.
With two months of campaigning still to go, competition is likely to intensify across much of the country as parties seek to consolidate support in their strongholds while making inroads into areas where they currently trail competitors.
This table illustrates the relative strength of parties across the country. The ANC faces an uphill battle in many provinces, while the DA continues to dominate in the Western Cape but will need a strong campaign if it hopes to make significant gains elsewhere.
MK remains largely a KwaZulu-Natal phenomenon, while the EFF is making notable inroads in Mpumalanga and the Eastern Cape and continues to perform well in Limpopo. ActionSA's support remains concentrated in Gauteng, while the IFP's strength is largely confined to KwaZulu-Natal. The Patriotic Alliance remains a factor primarily in the Western Cape.
Metro voting intentions reveal several closely contested races
Voting intentions in South Africa's major metropolitan municipalities reveal a highly competitive electoral landscape, highlighting the very different political dynamics unfolding across the country's largest urban centres4.
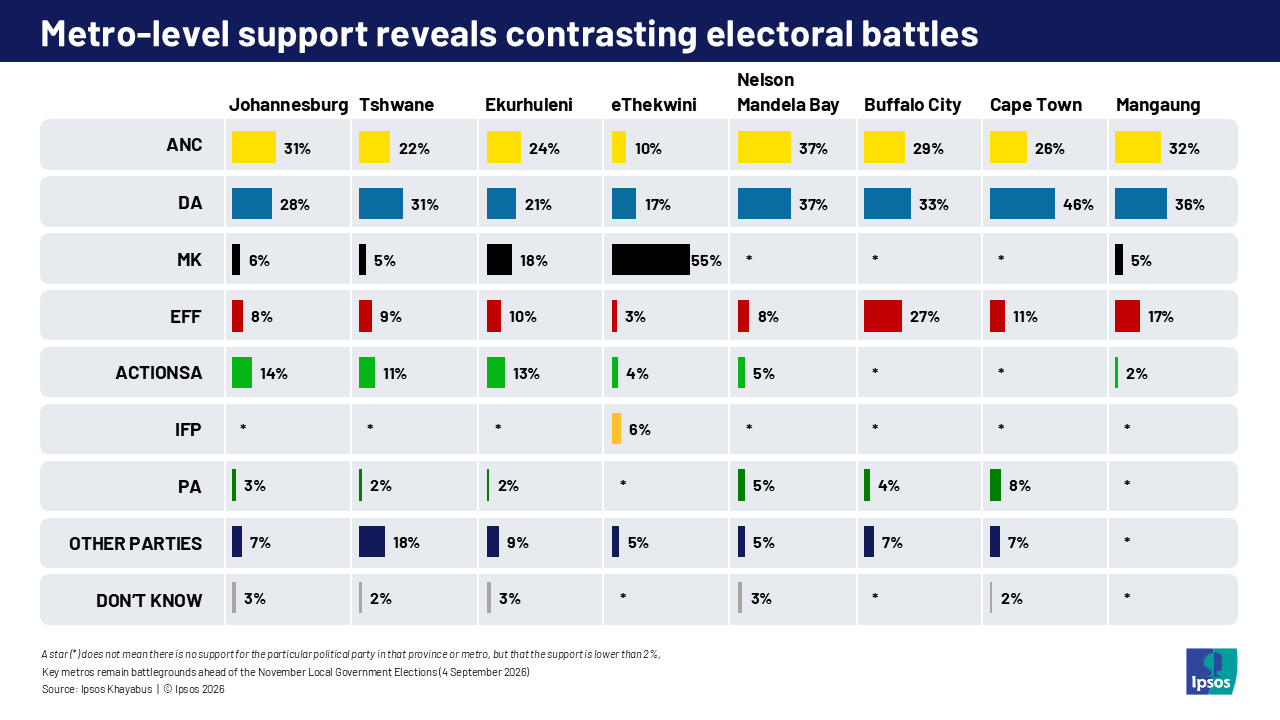
The ANC and DA remain the leading parties in most metros
Current voting intentions suggest that Johannesburg, Ekurhuleni, Nelson Mandela Bay and Buffalo City could see particularly competitive races between the ANC and DA.
Cape Town remains a DA stronghold
The DA records its strongest metro support in Cape Town (46%) and could potentially exceed 50% support as campaigning continues.
MK dominates eThekwini
MK records majority-level support in eThekwini (55%), significantly outperforming other parties in the metro.
EFF support is concentrated in Buffalo City
Although support for the EFF varies across metros, it reaches 27% in Buffalo City, substantially higher than elsewhere. This places the party in a strong competitive position in the metro.
ActionSA's strongest support remains in Gauteng
ActionSA records double-digit support in Johannesburg, Tshwane and Ekurhuleni, suggesting its greatest electoral presence remains concentrated in Gauteng's metropolitan areas.
“What stands out is that there is no single metropolitan story unfolding across South Africa,” says Mari Harris, Political Analyst at Ipsos in South Africa. “Different parties are competing from very different positions of strength depending on the metro. While some cities appear headed for closely contested ANC-DA races, others show strong support for regional or smaller parties.
“Currently, only MK shows a strong dominant position in eThekwini, suggesting that many metro’s are headed for coalition governments. This makes the coalition discussions after the elections and the choice of coalition partners of vital importance for the functioning of local government in South Africa and the delivery of basic services to citizens.”
1 The margin of error for this subsample, dependent on sample size, response rate and sampling methodology, at a 95% confidence level and a response rate of 50% is a maximum of ±1.77%.
2 Ipsos has used this technique for several years to give respondents the choice to make their own mark to indicate their political choice on an “imitation ballot paper”. This is a simulation of a secret vote and gives respondents who are apprehensive to state their political choices out loud to participate without fear or hesitation.
3 The sample size in the Northern Cape is low.
4 Note: Results for Nelson Mandela Bay, Buffalo City and Mangaung should be interpreted with caution because the sample sizes for these metros are relatively small.
About the study
Khayabus:
This press release is based on the views of 3,600 randomly selected respondents. Interviews were conducted by trained Ipsos interviewers in the homes and home languages of respondents. Interviews were conducted between June and July 2026. A scientific process of multi-stage stratified random selection distributed interviews in all areas of the county, including deep rural areas. This methodology ensured that the results are representative of the views of the universe (adult South Africans) and that findings can be weighted and projected to the universe. All results were collated and analysed in an aggregate format to protect the identity and confidentiality of respondents. In data processing filters were applied to isolate the group of respondents who are registered to vote. All sample surveys are subject to a margin of error, determined by sample size, sampling methodology and response rate. The margin of error, dependent on sample size, response rate and sampling methodology, at a 95% confidence level and a response rate of 50% is a maximum of ±1.77% for the sample of registered voters as a whole. However, when those who have indicated that they are not going to vote are excluded and the sample is then divided into provinces and metropolitan areas the margins of error for the smaller sample sizes increase. The table below is an illustration of the maximum margins or error for the different provincial samples and metropolitan samples – at a 95% confidence level and a response rate of 50%. Some of the findings should thus be regarded as indicative (**) or should be used with caution (****); Provinces (Maximum of MofE) - Gauteng (±3.44); Western Cape (±5.15); KwaZulu-Natal (±4.27); Mpumalanga (±7.94); Free State (±9.75**); North West (±8.89**); Limpopo (±8.54**); Eastern Cape (±6.86); Northern Cape (±12.12****). Metropolitan areas (Maximum of MofE) - Johannesburg (±5.57); Tshwane (±7.94); Ekurhuleni (±6.86); eThekwini (±6.86); Nelson Mandela Bay (±12.12****); Buffalo City (±15.46****); Cape Town (±6.12); Mangaung (±15.46****).