Urban Indians rate the education system high on quality, resources and facilities and career-oriented learning: Ipsos Global Education Monitor 2024
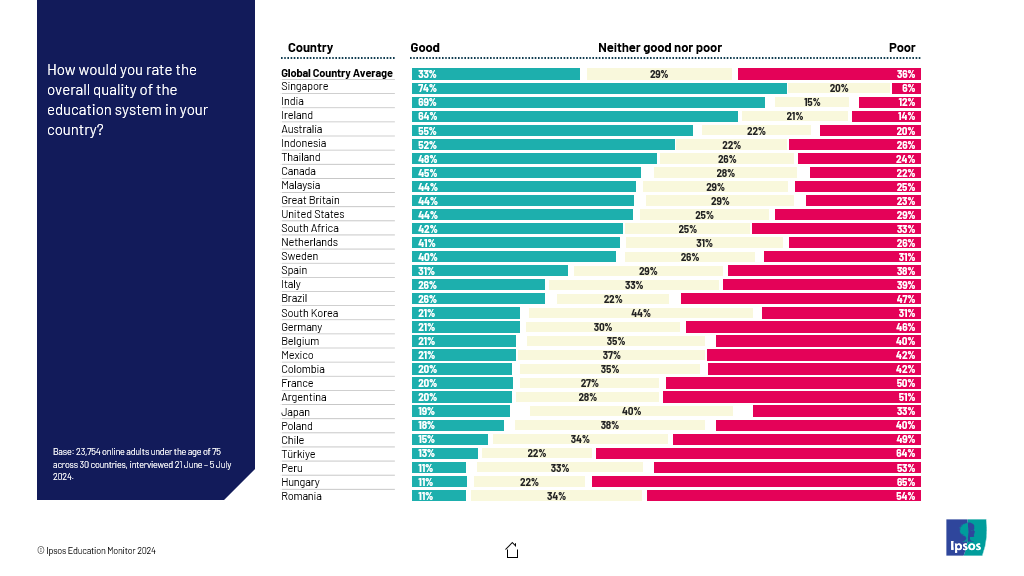
Almost 7 in 10 urban Indians (69%) have rated India high on the quality of education, placing it 2nd in the overall ranking, preceded by Singapore (74%).
Further 72% of Indians polled believe the higher education/ university system prepares students for future careers, with school curriculum too oriented for future careers (74%); aims to reduce social inequality (72%) and is equipped with adequate resources and facilities (textbooks, technology, laboratories etc.).
Clearly the axis has shifted to Asia Pacific in the quality of education available.
 Tech and education
It’s a mixed bag. 73 per cent of Indians polled want social media banned both inside and outside of schools for children aged under 14 years and at least 1 in 2 (52%) want smartphones banned in schools. Some of the markets favoring a ban on social media for kids under 14, were France (80%), Indonesia (79%), Colombia (76%), Peru (74%) and South Africa (74%).
While advances in technology (including AI) is likely to affect education in the future, 23% Indian citizens perceive this as positive, while 32% believe this could have both a positive and a negative impact on education.
Even on ChatGPT in schools, citizens’ views were divided – with 34% being in favor of ChatGPT and 39% wanting a ban on ChatGPT in schools.
Challenges in the education system
Urban Indians believe that our education system though among the best in the world has some of these challenges that are a red flag. Inadequate teacher training (29%) was the biggest concern, followed by unequal access to education (25%), safety and security (24%), insufficient usage of technology (24%), overcrowded classrooms, potential ideological bias (22%), inadequate infrastructure (21%), high dropout rates (21%), staff wellbeing (21%), outdated curriculum (20%), lack of public funding (17%), among others.
For global citizens, the top concerns were, outdated curriculum (29%), inadequate teacher training (27%), unequal access to education (26%) and overcrowded classrooms (26%), among others.
Interestingly the survey event asked certain cohorts to identify their top concerns and challenges around the education system, and Gen Z called out outdated curriculum (30%), for millennials too it was the outdated curriculum (27%), Gen X felt inadequate teacher training (30%) was the biggest area of concern and boomers called out overcrowded classrooms (31%) as a big challenge.
Summarizing on the findings of the Ipsos Education Monitor 2024, Amit Adarkar, CEO, Ipsos India said, “Our education system rivals some of the best education systems in the world. But do we acknowledge, realize and pride in our learning ecosystem? The reality is we perceive global institutions far higher than our own local ace institutions, while India has emerged among top markets in the quality of education and infrastructure in the survey. While the education system has mandated teachers to have certain compulsory degrees for teaching, the survey shows, there is a strong need of training for teachers emerging. Equity in education apart from inclusion; safety and security too are viewed as areas of concern, around our education centres. There is a strong emphasis on a complete ban on social media for children aged under 14, both in schools and outside (homes etc). Of late some parents are making their tiny tots make reels for Instagram which is setting a wrong precedent and unless checked will negatively impact the formative years of children. The pandemic had initiated children into online studies and tablets, but our survey also shows a strong need of a ban on smartphones emerging for children.”
Notably, 69% citizens believe our schools provide safe spaces free from violence and bullying and 67% agree schools embrace and welcome diversity and differences among learners.
Expectations from teachers
Interestingly, among Indians, when it comes to different forms of learning, citizens were willing to share the responsibility with teachers. And not completely making the education centre or teachers accountable. This trend was seen to be particularly profound in India.
- Basic literacy and numeracy – responsibility of teachers/ school (52%); responsibility of parents (41%)
- Offering career guidance – responsibility of teachers/ school (56%); responsibility of parents (37%)
- Teaching digital literacy and online safety – responsibility of teachers/ school (56%); responsibility of parents (37%)
- Addressing bullying – responsibility of teachers/ school (42%); responsibility of parents (48%)
- Developing social skills – responsibility of teachers/ school (49%); responsibility of parents (45%)
- Encouraging a love of reading – responsibility of teachers/ school (50%); responsibility of parents (44%)
- Providing sex education – responsibility of teachers/ school (47%); responsibility of parents (40%)
- Overseeing homework – responsibility of teachers/ school (37%); responsibility of parents (55%)
- Ensuring mental wellbeing – responsibility of teachers/ school (42%); responsibility of parents (50%)
- Teaching moral and ethical values – responsibility of teachers/ school (46%); responsibility of parents (47%)
- Teaching religious values – responsibility of teachers/ school (39%); responsibility of parents (84%)
- Teaching manners and politeness – responsibility of teachers/ school (43%); responsibility of parents (51%)
Methodology
These are the results of a 30-country survey conducted by lpsos on its Global Advisor online platform and in India, on its lndiaBus platform, between Friday, June 21 and Friday, July 5, 2024. For this survey, lpsos interviewed a total of 23,754 adults aged 18 years and older in India, 18-74 in Canada, Republic of Ireland, Malaysia, South Africa, Türkiye, and the United States, 20-74 in Thailand, 21-74 in Indonesia and Singapore, and 16-74 in all other countries. The sample consists of approximately 2,000 individuals in Japan, 1,500 each in Germany and Brazil, and 1,000 individuals each in Australia, Canada, France, Great Britain, Italy, Spain, and the U.S., and 500 individuals each in Argentina, Belgium, Chile, Colombia, Hungary, Indonesia, Ireland, Malaysia, Mexico, the Netherlands, Peru, Poland, Romania, Singapore, South Africa, South Korea, Sweden, Thailand, and Türkiye.
The sample in India consists of approximately 2,200 individuals, of whom approximately 1,800 were interviewed face-to-face and 400 were interviewed online. Samples in Argentina, Australia, Belgium, Canada, France, Germany, Great Britain, Hungary, Italy, Japan, the Netherlands, Poland, South Korea, Spain, Sweden, and the U.S. can be considered representative of their general adult populations under the age of 75. Samples in Brazil, Chile, Colombia, Indonesia, Ireland, Malaysia, Mexico, Peru, Romania, Singapore, South Africa, Thailand, and Türkiye are more urban, more educated, and/or more affluent than the general population.
The survey results for these countries should be viewed as reflecting the views of the more "connected" segment of their population. India's sample represents a large subset of its urban population - social economic classes A, B and C in metros and tier 1-3 town classes across all four zones. The data is weighted so that the composition of each country's sample best reflects the demographic profile of the adult population according to the most recent census data. "The 30-Country Average" reflects the average result for all the countries and markets in which the survey was conducted. It has not been adjusted to the population size of each country or market and is not intended to suggest a total result. When percentages do not sum up to 100 or the 'difference' appears to be +/-1 percentage point more/less than the actual result, this may be due to rounding, multiple responses, or the exclusion of "don't know" or not stated responses.
The precision of lpsos online polls is calculated using a credibility interval with a poll where N=l,000 being accurate to +/- 3.5 percentage points and of where N=500 being accurate to+/- 5.0 percentage points. For more information on lpsos' use of credibility intervals, please visit the lpsos website. The publication of these findings abides by local rules and regulations.