Drop in U.S. consumer sentiment erases recent gains
Washington, DC, April 21, 2022 – Americans’ economic sentiment has cooled down as indicated by Ipsos-Forbes Advisor U.S. Consumer Confidence Tracker’ drop of 2.3 points from two weeks ago. The decline reverses a brief resurgence in consumer optimism seen earlier in April and a return to its same level during much of the first quarter.
Affluent Americans – those with a household income of $100,000 or more – are the demographic group showing the steepest drop in sentiment (-6.7 points) over the past two weeks.
The survey conducted this week by Ipsos finds a notable decline in purchasing confidence, for big-ticket items as well as for other household goods, and in investment sentiment. With inflation continuing to hit historic highs, majorities of Americans expect inflation to continue to rise, along with their mortgage payments, monthly expenses, and taxes.
Read the full story from Forbes Advisor here.
Learn more about the Ipsos Global Consumer Confidence Index and sub-indices via the interactive portal, Ipsos Consolidated Economic Indicators (IpsosGlobalIndicators.com) including graphic comparisons, trended data and all the questions on which they are based.
Detailed Findings
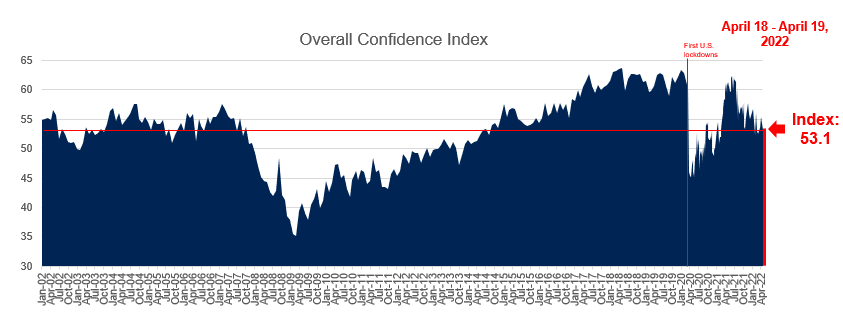
1. Scoring at 53.1, the latest Overall Consumer Confidence index falls 2.3 points from two weeks ago.
- The Overall Confidence Index is currently 0.7 points below the pandemic average, and 7 points below where it stood in early March 2020, prior to the first lockdowns (60.1). However, it is on par with its 20-year historical average.
2. The Current and Investment sub-indices both show a sharp decline of 4.0 and 4.1 points, respectively. Both are about 10 points lower than pre-pandemic and lower by 2 to 4 points than both their pandemic and 20-year historical average. The Expectations sub-index show less volatility, falling by 1.0 point, but seeing its gain of two weeks ago reversed.
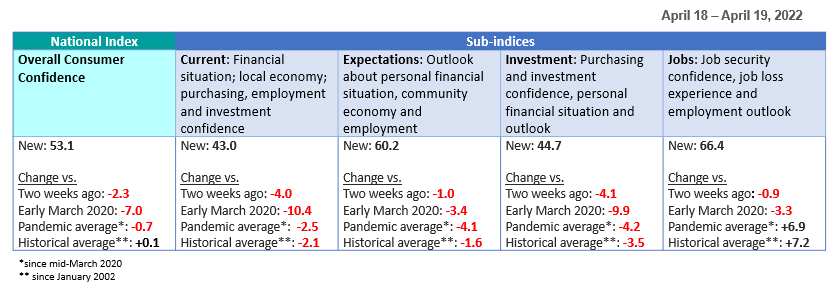
3. The Jobs sub-index shows a 0.9-point drop from two weeks ago and is still about 3 points lower than pre-pandemic. Nevertheless, it remains relatively strong, exceeding both its pandemic and historical averages by about 7 points.
- The proportion of Americans who say they are more confident in their job security now compared to 6 months ago is at 50%, down 3 points from two weeks ago.
- The proportion of Americans reporting they, a family member, or a personal acquaintance lost their job in the past six months due to economic conditions is at 24%, down 1 point from two weeks ago.
- In addition, 39% say it’s at least somewhat likely that they, a family member, or a personal acquaintance will lose their job in the next six months due to economic conditions, up 4 points from two weeks ago.
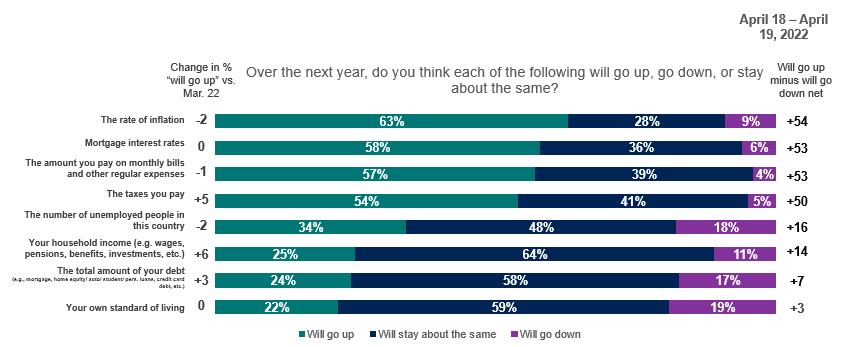
4. Most Americans expect inflation to continue to rise over the next year, along with mortgage interest rates, their monthly expenses, and their taxes, but only one-quarter have the same expectation about their household income.
- Compared to earlier surveys asking the same questions, the most notable changes are an increase in the percentages of those expecting their taxes to go up (by 5 points since four weeks ago and by 10 points since mid-January) and those expecting their income to increase (by 6 points since last month).
5. Comfort with making major purchases relative to six months ago experiences a sharp decline as approximately two in five are comfortable with other purchases.
- 38% say they are more comfortable making major household purchases compared to six months ago, down 6 points from two weeks ago.
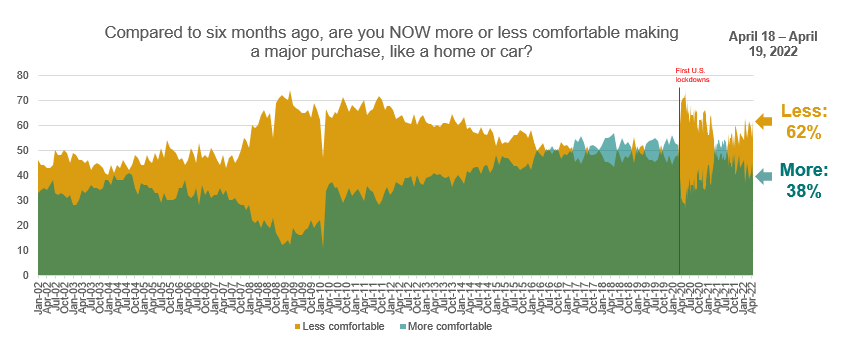
- 43% say they are more comfortable making other household purchases compared to six months ago, down 4 points from two weeks ago.

Questions
The data used for the Consumer Confidence index and sub-indices is based on the following questions:
1. Now, thinking about our economic situation, how would you describe the current economic situation in US? Is it… very good, somewhat good, somewhat bad or very bad?
2. Rate the current state of the economy in your local area using a scale from 1 to 7, where 7 means a very strong economy today and 1 means a very weak economy.
3. Looking ahead six months from now, do you expect the economy in your local area to be much stronger, somewhat stronger, about the same, somewhat weaker, or much weaker than it is now?
4. Rate your current financial situation, using a scale from 1 to 7, where 7 means your personal financial situation is very strong today and 1 means it is very weak
5. Looking ahead six months from now, do you expect your personal financial situation to be much stronger, somewhat stronger, about the same, somewhat weaker, or much weaker than it is now?
6. Compared to 6 months ago, are you NOW more or less comfortable making a major purchase, like a home or car?
7. Compared to 6 months ago, are you NOW more or less comfortable making other household purchases?
8. Compared to 6 months ago, are you NOW more or less confident about job security for yourself, your family and other people you know personally?
9. Compared to 6 months ago, are you NOW more or less confident of your ability to invest in the future, including your ability to save money for your retirement or your children’s education?
10. Thinking of the last 6 months, have you, someone in your family or someone else you know personally lost their job as a result of economic conditions?
11. Now look ahead at the next six months. How likely is it that you, someone in your family or someone else you know personally will lose their job in the next six months as a result of economic conditions?
Additional question:
1. Over the next year, do you think each of the following will go up, go down, or stay about the same?
- The rate of inflation
- Mortgage interest rates
- The amount you pay on monthly bills and other regular expenses
- The taxes you pay
- The number of unemployed people in this country
- Your household income (e.g. wages, pensions, benefits, investment, etc.)
- The total amount of your debt (e.g., mortgage, home equity/ auto/ student/ pers. loans, credit card debt, etc.)
- Your own standard of living
About the Study
These findings are based on data from an Ipsos survey conducted April 18-19, 2022 with a sample of 927 adults aged 18-74 from the continental U.S., Alaska, and Hawaii who were interviewed online in English.
The sample was randomly drawn from Ipsos’ online panel, partner online panel sources, and “river” sampling and does not rely on a population frame in the traditional sense. Ipsos uses fixed sample targets, unique to each study, in drawing a sample. After a sample has been obtained from the Ipsos panel, Ipsos calibrates respondent characteristics to be representative of the U.S. Population using standard procedures such as raking-ratio adjustments. The source of these population targets is U.S. Census 2016 American Community Survey data. The sample drawn for this study reflects fixed sample targets on demographics. Post-hoc weights were made to the population characteristics on gender, age, race/ethnicity, region, and education.
Statistical margins of error are not applicable to online non-probability polls. All sample surveys and polls may be subject to other sources of error, including, but not limited to coverage error and measurement error. Where figures do not sum to 100, this is due to the effects of rounding. The precision of Ipsos online polls is measured using a credibility interval. In this case, the poll has a credibility interval of plus or minus 3.9 percentage points for all respondents. Ipsos calculates a design effect (DEFF) for each study based on the variation of the weights, following the formula of Kish (1965). This study had a credibility interval adjusted for design effect. For n=927, DEFF=1.5 and adjusted Confidence Interval=+/-5.4 percentage points.
Findings from March 2010 to early March 2020 are based on data from Refinitiv /Ipsos’ Primary Consumer Sentiment Index (PCSI) collected in a monthly survey on Ipsos’ Global Advisor online survey platform with the same questions. For the PCSI survey, Ipsos interviews a total of 1,000+ U.S. adults aged 18-74. The Refinitiv/Ipsos Primary Consumer Sentiment Index (PCSI), ongoing since 2010, is a monthly survey of consumer attitudes on the current and future state of local economies, personal finance situations, savings, and confidence to make large investments. The PCSI metrics reported each month consist of a “Primary Index” based on 10 questions available upon request and of several “sub-indices” each based on a subset of these 10 questions. Those sub-indices include a Current Index, an Expectations Index, an Investment Index, and a Jobs Index.
Findings for January 2002- February 2011 are based on data from the RBC CASH Index, a monthly telephone survey of 1,000 U.S. adults aged 18 and older conducted by Ipsos with a margin of error of +/- 3.1 percentage points.
For more information on this news release, please contact:
Chris Jackson
Senior Vice President, US
Public Affairs
+1 202 420 2025
About Ipsos
Ipsos is the world’s third largest Insights and Analytics company, present in 90 markets and employing more than 18,000 people.
Our passionately curious research professionals, analysts and scientists have built unique multi-specialist capabilities that provide true understanding and powerful insights into the actions, opinions and motivations of citizens, consumers, patients, customers or employees. We serve more than 5000 clients across the world with 75 business solutions.
Founded in France in 1975, Ipsos is listed on the Euronext Paris since July 1st, 1999. The company is part of the SBF 120 and the Mid-60 index and is eligible for the Deferred Settlement Service (SRD).
ISIN code FR0000073298, Reuters ISOS.PA, Bloomberg IPS:FP www.ipsos.com