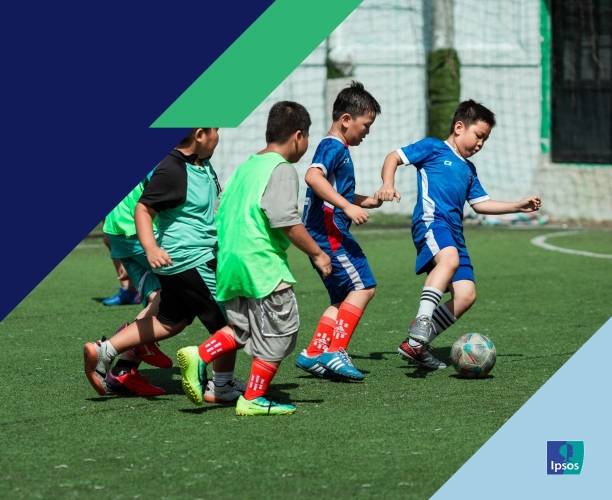
Vast majority of sports parents feel the benefits of youth sports outweigh the drawbacks
Washington, D.C., August 13, 2026 – While parents of children who play organized sports acknowledge there are some drawbacks of youth sports, they overwhelmingly say that the benefits outweigh the drawbacks, according to a new Associated Press/Ipsos survey of parents of K-12 children that participate in organized sports.
The survey, conducted among 1,737 U.S. adults and 510 parents of K-12 children who participate in organized sports, finds that sports parents identify a wide range of benefits for children who play sports, including learning about hard work and commitment, learning to work with others, and improving physical fitness. Parents see drawbacks as well, such as the risk of chronic injuries, the risk brain injuries, and the risk of burnout. However, these concerns resonate less strongly with parents than the perceived benefits.
The survey also explores what sports children play, why children join and quit sports, challenges facing families when it comes to youth sports, and views of tackle football.
Click here to see the full study findings.
Detailed findings
1. Children play a wide range of sports, with soccer being the most popular.
- Among parents of school-aged children (children entering grades K-12 in the 2026-2027 school year), 54% say that they have at least one child who plays organized sports, meaning they are on a school or club team, recreational league, or another structured sport with a schedule.
- Children participate in sports in a variety of ways. Most commonly, sports parents report that their child currently participates in or has participated in recreational sports teams (72%) or school sports teams (64%), followed by training independently (45%), joining a travel or club sports team (44%), or joining an academy sports team (26%).
- Soccer (31%) is the most popular sport that parents say their children participate in, followed by basketball (25%), softball or baseball (20%), cheerleading or dance (16%), swimming or diving (14%), track and field (14%), and volleyball (14%).
- When asked what should be prioritized in youth sports, a majority of sports parents (65%) say having fun and learning to compete and succeed should be both equally emphasized; 27% say that having fun should be emphasized more, while 8% say learning to compete should be emphasized more.
2. Why children join – and quit – playing sports.
- Sports parents say that a mix of their child’s interest (97%) and encouragement from them as a parent (93%) are major or minor reasons why their child wants to play youth sports.
- In addition, sports parents also say that the influence of their children’s friends (81%) or their children’s school (65%) plays a major or minor role in their child’s interest in youth sports.
- However, more broadly, 37% of parents of a K-12 child say that their child has ever quit or stopped playing an organized sport. Among these parents, the most commonly reported reason why children quit sports is because they lost interest (86%).
- These parents also report that their children quit because they didn’t feel they were good enough (51%), because the sport was too expensive (41%), because there was too much pressure to perform (40%), or due to bullying or other negative behavior (26%).
3. Sports parents feel that playing organized sports offer a number of physical and developmental benefits for children.
- Sports parents identify wide range of major or minor benefits for children who play organized sports. These include:
- Making friends with other children their age (98%)
- Learning about hard work and commitment (97%)
- Learning to work with others as part of a team (97%)
- Learning to deal with adversity (97%)
- Improving physical fitness (96%)
- Reducing the time they spend on screens or technology (96%)
- Sports parents also identified a number of drawbacks, although these drawbacks resonated less strongly than the perceived benefits. These include:
- The possibility of burnout (78%)
- Risking chronic, long-lasting injuries (77%)
- Risking injuries to the brain (75%)
- Pressure from parents or coaches (73%)
- Missing out on events with family or friends (71%)
4. Sports parents identify a number of challenges on their family associated with youth sports – but largely feel the benefits outweigh the drawbacks.
- Sports parents largely view their children’s participation in youth sports with pride and happiness, with 79% and 77%, respectively, saying these emotions describe how they feel about their children playing organized sports extremely or very well. Positive emotions significantly outnumber negative emotions: just 16% say stress and just 15% say “burned out” describes how they feel about their children playing sports.
- However, sports parents point to a number of challenges on their household when it comes to youth sports. Top concerns include “scheduling and logistics” and the time commitment, with 84% of sports parents noting that both these issues are major or minor challenges for their household. Other challenges include team or club fees (73%), the amount of travel (72%), and equipment or uniform costs (69%).
- Despite the drawbacks and challenges, sports parents overwhelmingly say the benefits of youth sports outweigh the drawbacks for their family (89%). Just 9% say the drawbacks outweigh the benefits.
About the Study
This poll was conducted by Ipsos on behalf of the Associated Press between July 21–26, 2026, by Ipsos using the probability-based KnowledgePanel®. This poll is based on a nationally representative probability sample of 1,737 general population adults aged 18 or older, including an oversample of 510 parents of at least one K-12 child who plays organized sports.
The study was conducted in English and Spanish. The data were weighted to adjust for gender by age, race and ethnicity, census region, metropolitan status, education, household income, 2024 vote choice, and political party identification. Political party identification benchmarks are from the 2026 NPORS annual survey. The demographic benchmarks came from the 2025 March supplement of the U.S. Census Bureau’s Current Population Survey (CPS), except language dominance within Hispanics, which was obtained from the 2024 American Community Survey (ACS). The parental status benchmark was derived from the general population sample.
- Gender (Male, Female) by Age (18–29, 30–44, 45-59 and 60+)
- Race/Hispanic Ethnicity (White Non-Hispanic, Black Non-Hispanic, Other, Non-Hispanic, Hispanic, 2+ Races, Non-Hispanic)
- Census Region (Northeast, Midwest, South, West) by Metropolitan Status (Metro, Non-Metro)
- Education (Less than High School, High School, Some College, Bachelor’s degree, Master’s degree or higher)
- Household Income (Under $25,000, $25,000-$49,999, $50,000-$74,999, $75,000-$99,999, $100,000-$149,999, $150,000+)
- Language Dominance (English Dominant Hispanic, Bilingual Hispanic, Spanish Dominant Hispanic, Non-Hispanic)
- 2024 Vote Choice (Trump, Harris, Another candidate, Did not vote)
- Political Party ID (Democrat, Lean Democrat, Republican, Lean Republican, Independent/Something else)
- Parents Status (Not a parent of 0-18 children, Parent of 0-18 children but none in K-12, Parent of K-12 with no sports children, Parent of K-12 with sports children)
The margin of sampling error is plus or minus 2.7 percentage points at the 95% confidence level, for results based on the entire sample of adults. The margin of sampling error takes into account the design effect, which was 1.34. For results based on parents of school-aged child(ren) who play organized sports, the margin of sampling error is plus or minus 4.9 percentage points at the 95% confidence level. The margin of sampling error takes into account the design effect, which was 1.28.
The margin of sampling error is higher and varies for results based on sub-samples. In our reporting of the findings, percentage points are rounded off to the nearest whole number. As a result, percentages in a given table column may total slightly higher or lower than 100%. In questions that permit multiple responses, columns may total substantially more than 100%, depending on the number of different responses offered by each respondent.
For more information on this news release, please contact:
Alec Tyson
Senior Vice President, US
Public Affairs
[email protected]
Johnny Sawyer
Senior Research Manager, US
Public Affairs
[email protected]
About Ipsos
Ipsos is one of the largest market research and polling companies globally, operating in 90 markets and employing nearly 20,000 people.
Our passionately curious research professionals, analysts and scientists have built unique multi-specialist capabilities that provide true understanding and powerful insights into the actions, opinions and motivations of citizens, consumers, patients, customers or employees. Our 75 business solutions are based on primary data from our surveys, social media monitoring, and qualitative or observational techniques.
“Game Changers” – our tagline – summarizes our ambition to help our 5,000 clients navigate with confidence our rapidly changing world.
Founded in France in 1975, Ipsos has been listed on the Euronext Paris since July 1, 1999. The company is part of the SBF 120, Mid-60 indices, and is eligible for the Deferred Settlement Service (SRD).
ISIN code FR0000073298, Reuters ISOS.PA, Bloomberg IPS:FP www.ipsos.com
35 rue du Val de Marne
75 628 Paris, Cedex 13 France
Tel. +33 1 41 98 90 00