Trump bests Harris on reported supporter turnout
Washington, D.C., November 25, 2024 – The latest Ipsos National poll finds that the 2024 electorate was more Republican than Democrat. More Trump supporters say they ultimately voted for former President Donald Trump on election day than Harris supporters say they voted for Vice President Kamala Harris. At the demographic level, Americans are more likely to say they voted for Trump than Harris if they are white, not college educated, male, or ages 65+. Americans are more likely to say they voted for Harris over Trump if they are Black, Hispanic, college-educated, female, or ages 18-29. While there are no significant differences in reported net vote share by gender among Black Americans, Hispanic men are more likely to say they voted for Trump over Harris while Hispanic women are more likely to say they voted for Harris over Trump.
When it comes to policy platforms, more Americans say they heard a great deal or a fair amount about Trump’s plans than Harris’ prior to the election. That said, Americans are split on whether they say they thought Trump’s plans would help or hurt them personally if he won the election. After the election, Americans continue to report that inflation, followed by immigration and political extremism, is the most important issue facing the country. About half of Americans state that inflation is the single most important issue facing the U.S. right now. Finally, this poll explores Americans’ perspectives on voting security and voter fraud. On the one hand, a bare majority say American elections are usually fair, but Americans are divided on whether voter discrimination is a problem.

Detailed Findings:
1. In the 2024 election, the electorate was more Republican than Democrat, and non-voters are more likely to identify as Democrats than Republicans. Additionally, more Trump supporters say they voted for him than Harris supporters say they voted for her.
- Among Americans who voted in the 2024 election, more are Republican (51%) than Democrat (47%). Among Americans who report not voting, more are Democrats (43%) than Republicans (38%).
- Slightly more pre-election Trump supporters say they voted for Trump (73%) than pre-election Harris supporters say they voted for Harris (68%).
- Among Americans who said they would vote for Harris in the 2024 presidential election, 31% say they ultimately did not vote on election day. Fewer (26%) pre-election Trump supporters say they did not vote.
2. Trump bests Harris among Americans who are white, non-college educated, male, or ages 65+. However, differences emerge within demographic groups by gender.
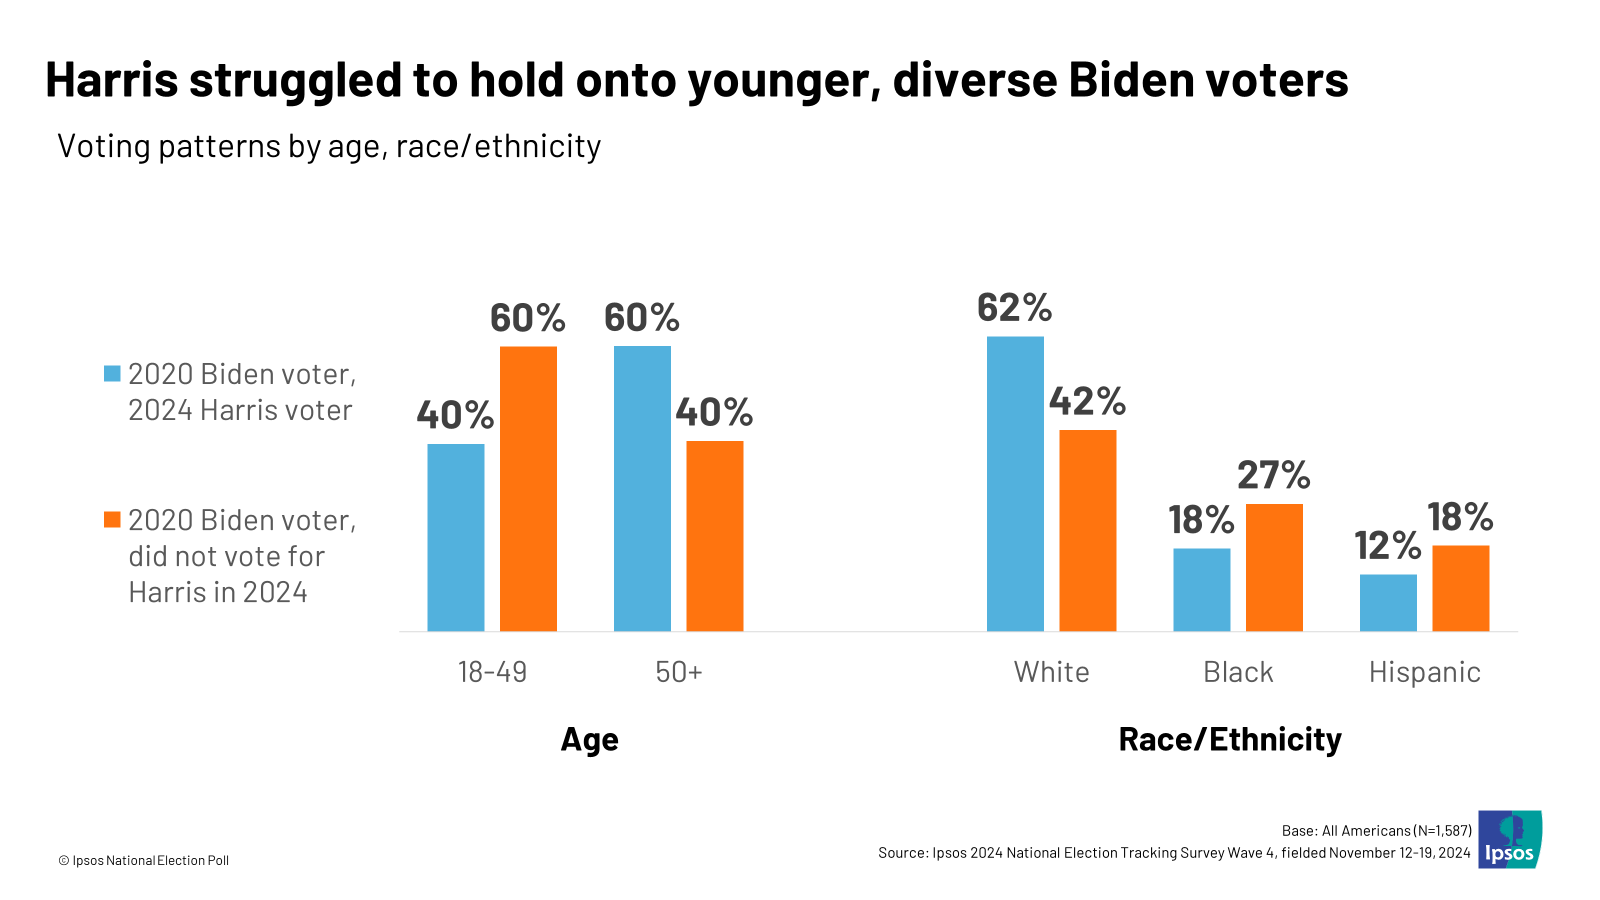
- Americans are net more likely to say they voted for Trump than Harris if they are white (+16 points), not college educated (+10 points), male (+12 points), or ages 65+ (+14 points).
- In contrast, Americans are net more likely to say they voted for Harris than Trump if they are Black (+71 points), Hispanic (+14 points), college-educated (+8 points), female (+9 points), or ages 18-29 (+11 points).
- Considering gender by age group, Trump did best with reported net vote share among men ages 65+ (+23 points). Harris did best with reported net vote share among women ages 18-29 (+40 points).
- Considering gender by race and ethnicity, Trump did best with reported net vote share among white men (+26 points). Harris did best with reported net vote share among Black men (+71 points) and Black women (+72 points).
- However, Hispanic women (+35 net Harris) are significantly more likely than Hispanic men (+4 net Trump) to say they voted for Harris over Trump.
3. Before the election, Americans were split on whether Trump’s plans and policies would help or hurt them personally. However, a plurality says they thought the Project 2025 policy proposal would hurt them.
- While two in five Americans say they thought Trump’s plans and policies would hurt them if he won, a similar share (38%) say they thought it would help them. Just 18% say they thought it would have no impact.
- More Americans say they heard a great deal or a fair amount before the election about Trump’s plans and policies than say so about Harris (60% vs. 44%, respectively).
- Forty-four percent of Americans say they thought the Project 2025 policy proposal would hurt them personally before the election. Just 9% say they thought it would help them. Meanwhile, 40% say they thought it would have no impact on them personally.
- Notably, most Americans (57%) say they did not see, hear, or read much about Project 2025 before the election. Just 40% say they heard a great deal or a fair amount.
4. After the election, inflation and immigration remain the most important issues among Americans.
- About half (53%) of Americans say inflation is the most important issue facing the country, followed by immigration (37%) and political extremism or polarization (24%).
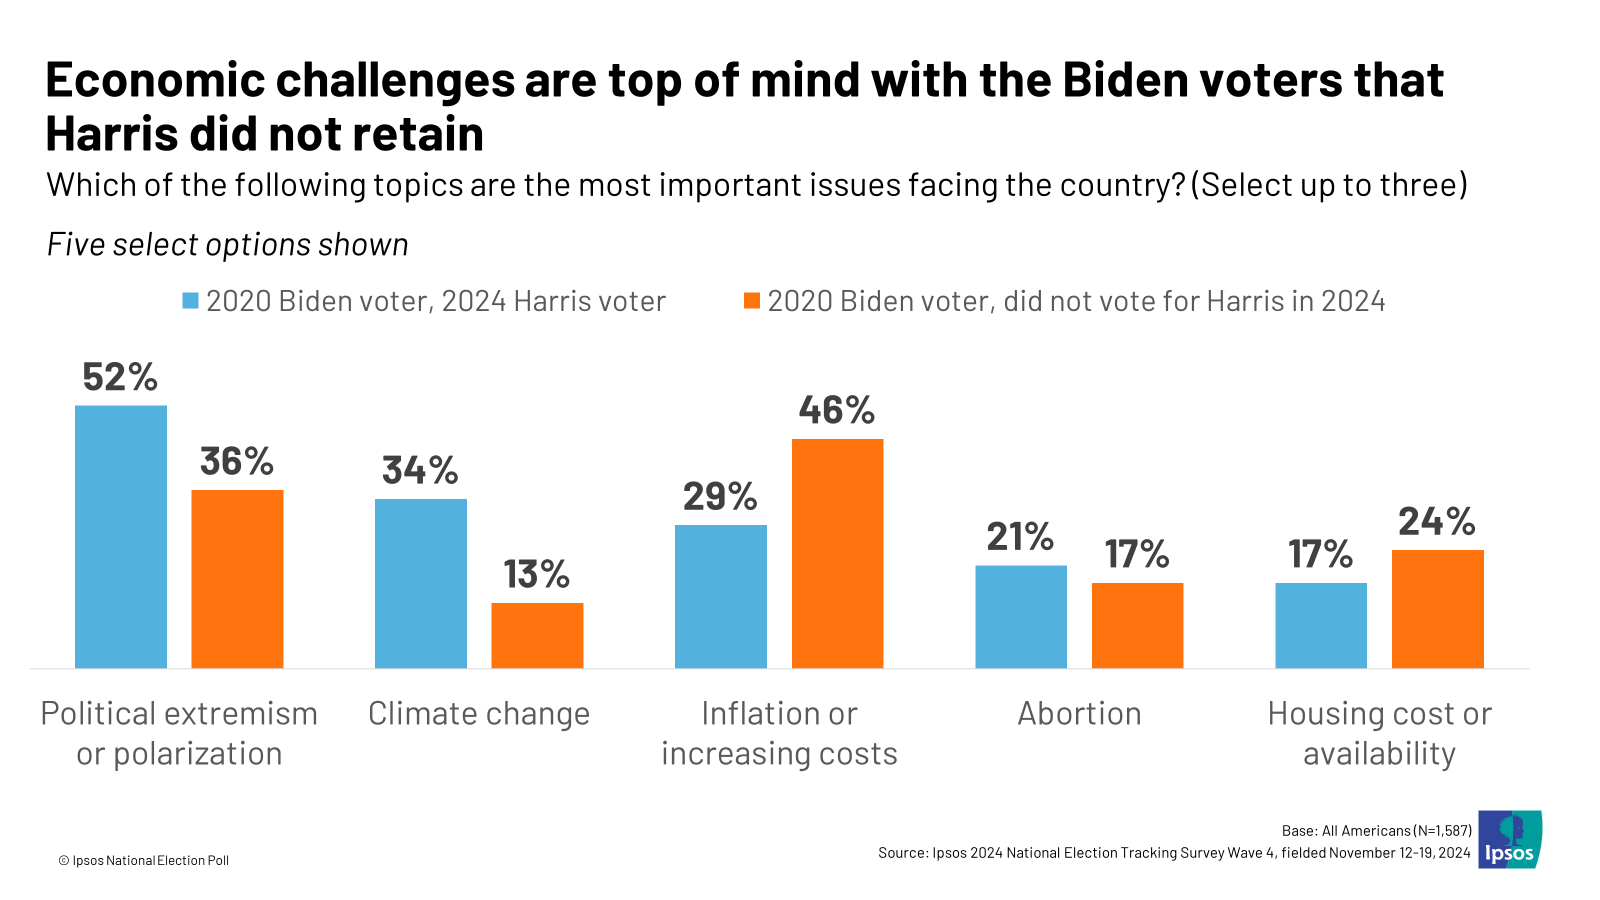
- When asked to select the single most important issue, a plurality (34%) of Americans cite inflation or increasing costs. Following inflation, 12% say immigration and 10% say political extremism or polarization.
- In the past month, a majority of Americans say they have seen a lot about immigration (64%), inflation (61%), and abortion (53%) in the news. Few (5%), however, select abortion as the single most important issue to them at this time.

5. A bare majority of Americans say elections in the U.S. are usually fair, and few say in-person voter fraud is a problem. However, Americans are divided on whether voter discrimination is a problem.
- About half (52%) of Americans say elections in the U.S. are usually fair, but 19% disagree. One-fifth (22%) neither agree nor disagree.
- Just 19% of Americans say in-person voter fraud is a problem in this country. A plurality (45%) say it is not a problem. One quarter (24%) say they neither agree nor disagree.
- One-third (32%) of Americans agree that voter discrimination is a problem in the U.S., while 33% disagree. One in four (25%) say they neither agree nor disagree.

About the Study
This Ipsos poll was conducted November 12-19, 2024, by Ipsos using the probability-based KnowledgePanel®. This poll is based on a representative probability sample of 1,587 adults age 18 or older.
The survey was conducted using KnowledgePanel, the largest and most well-established online probability-based panel that is representative of the adult US population. Our recruitment process employs a scientifically developed addressed-based sampling methodology using the latest Delivery Sequence File of the USPS – a database with full coverage of all delivery points in the US. Households invited to join the panel are randomly selected from all available households in the U.S. Persons in the sampled households are invited to join and participate in the panel. Those selected who do not already have internet access are provided a tablet and internet connection at no cost to the panel member. Those who join the panel and who are selected to participate in a survey are sent a unique password-protected log-in used to complete surveys online. As a result of our recruitment and sampling methodologies, samples from KnowledgePanel cover all households regardless of their phone or internet status and findings can be reported with a margin of sampling error and projected to the general population. KnowledgePanel members receive a per survey incentive, usually the equivalent of $1 (though for some it is $2) in points, that can be redeemed for cash or prizes. A prenotification email for this study was sent prior to field. Panelists receive a unique login to the survey and are only able to complete it one time. No reminder emails were sent for this study.
The margin of sampling error is plus or minus 2.8 percentage points at the 95% confidence level, for results based on the entire sample of adults. The margin of sampling error takes into account the design effect, which was 1.30. There may be other unmeasured non-sampling error in this or any poll. In our reporting of the findings, percentage points are rounded off to the nearest whole number. As a result, percentages in a given table column may total slightly higher or lower than 100%. In questions that permit multiple responses, columns may total substantially more than 100%, depending on the number of different responses offered by each respondent.
The study was conducted in both English and Spanish. The data were weighted to adjust for gender by age, race/ethnicity, education, Census region, metropolitan status, household income, party identification, race/ethnicity by gender, race/ethnicity by age, and race/ethnicity by education. The demographic benchmarks came from 2023 Current Population Survey (CPS) from the US Census Bureau. Party ID benchmarks are from the Pew NPORS 2024. The weighting categories were as follows:
- Gender (Male, Female) by Age (18-29, 30-44, 45-59, 60+)
- Race-Ethnicity (White/Non-Hispanic, Black/Non-Hispanic, Other/Non-Hispanic and 2+ Races/Non-Hispanic, Hispanic)
- Census Region (Northeast, Midwest, South, West) by Metropolitan Status (Metro, Non-Metro)
- Education (Less than High School, High School graduate or equivalent, Some College, Bachelor, Master or higher)
- Household Income (under $25K, $25K-$49,999, $50K-$74,999, $75K-$99,999, $100K-$149,999, $150K and over)
- Party ID (Republican, Lean Republican, Independent/Something else, Lean Democrat, Democrat)
For more information on this news release, please contact:
Chris Jackson
Senior Vice President, US
Public Affairs
+1 202 420-2025
[email protected]
About Ipsos
Ipsos is one of the largest market research and polling companies globally, operating in 90 markets and employing over 18,000 people.
Our passionately curious research professionals, analysts and scientists have built unique multi-specialist capabilities that provide true understanding and powerful insights into the actions, opinions and motivations of citizens, consumers, patients, customers or employees. We serve more than 5000 clients across the world with 75 business solutions.
Founded in France in 1975, Ipsos is listed on the Euronext Paris since July 1st, 1999. The company is part of the SBF 120 and the Mid-60 index and is eligible for the Deferred Settlement Service (SRD).
ISIN code FR0000073298, Reuters ISOS.PA, Bloomberg IPS:FP www.ipsos.com