The Ipsos Final Election poll
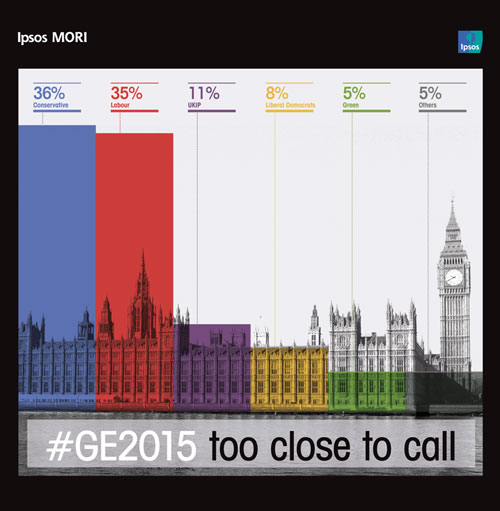
Ipsos’s Final Election Poll for the Evening Standard indicates that Britain may be on course for an indecisive general election result, with the Conservatives and Labour almost evenly matched in votes and both likely to be well short of an overall majority, while the contest for third place is close between the Liberal Democrats and UKIP. Our headline estimate of voting intention is Conservative 36%, Labour 35%, UKIP 11%, Liberal Democrat 8%, Greens 5% and Others 5%.
Three in four of those expressing a preference (78%) said they had definitely decided who they were going to vote for (higher than the last two elections), but even in the two days before the polls open, one in five (21%) said they may change their mind – potentially switching to a wide range of different parties, continuing one of the defining features of this campaign. The vast majority of registered voters say they are supporting the party that most represents their views (85%), but one in ten say they are voting for a party to keep another out, as the party they support has little chance of winning in their constituency – exactly the same as in 2010.
The election result is also seen as very important to registered voters – 86% say it is important to them who wins, the highest we have seen since the 1992 election. This increased in 2010 – another hard-fought election, and has increased again this year with the race even closer.
Despite the close race between the parties, David Cameron maintains his lead as most capable Prime Minister, preferred by 42% of registered voters, compared with 27% who chose Ed Miliband.
Eight in ten (82%) of registered voters are ‘absolutely certain to vote’. Our experience suggests that this figure tends to overstate the actual turnout. On this basis we would expect a turnout of between 72 and 74%.
Downloads
- Download the final poll topline (PDF)
- Download the charts (PDF)
- Download the computer tables (PDF)
- Download the Infographic (PDF)
Technical note
Ipsos interviewed a representative sample of 1,186 adults aged 18+ living in Great Britain, of whom 1,096 said they were registered to vote. Interviews were conducted by telephone, including both landline and mobile numbers, on Tuesday 5th and Wednesday 6th May 2015. Data are weighted to match the profile of the population. Voting intention figures are based only on the responses of those who said that they were registered and "absolutely certain to vote" (862 adults). In these final projection figures, adjustments were also made to account for those respondents who said they were certain to vote, but refused to say which party they supported (calculated on the basis of respondents' newspaper readership). This adjustment made no significant difference to the topline voting intention figures.


