Media source affects Americans’ understanding of crime, immigration, the economy
Washington, DC, October 16, 2024 — A new Ipsos poll finds that where Americans get their news affects their perceptions of the economy, crime, and immigration. Americans who primarily consume conservative media sources are more likely to support Trump across all policies asked; meanwhile, Americans who primarily consume cable news or national newspapers are significantly more likely to prefer Harris’ approach across policy areas. Americans who have correct information on current political issues are more likely to say Harris is stronger than Trump when it comes to policies including healthcare, political extremism, crime, the economy, foreign conflicts, and immigration. Notably, Americans who primarily consume conservative media are the least likely group to correctly answer fact-based questions around inflation, crime, and FEMA aid.
This Ipsos poll also finds that primary media sources affect Americans’ perceptions of their personal economic situation, including grocery costs, gasoline costs, and having to delay making purchases. For example, while one in four Americans overall say they have seen grocery or gasoline costs go down, nearly half of Americans who primarily consume cable news and national newspapers say they have seen these costs go down, compared to just one in ten Americans who primarily consume Fox News and other conservative media outlets.
For more information about this Ipsos Core Political poll, please click here.
Detailed Findings
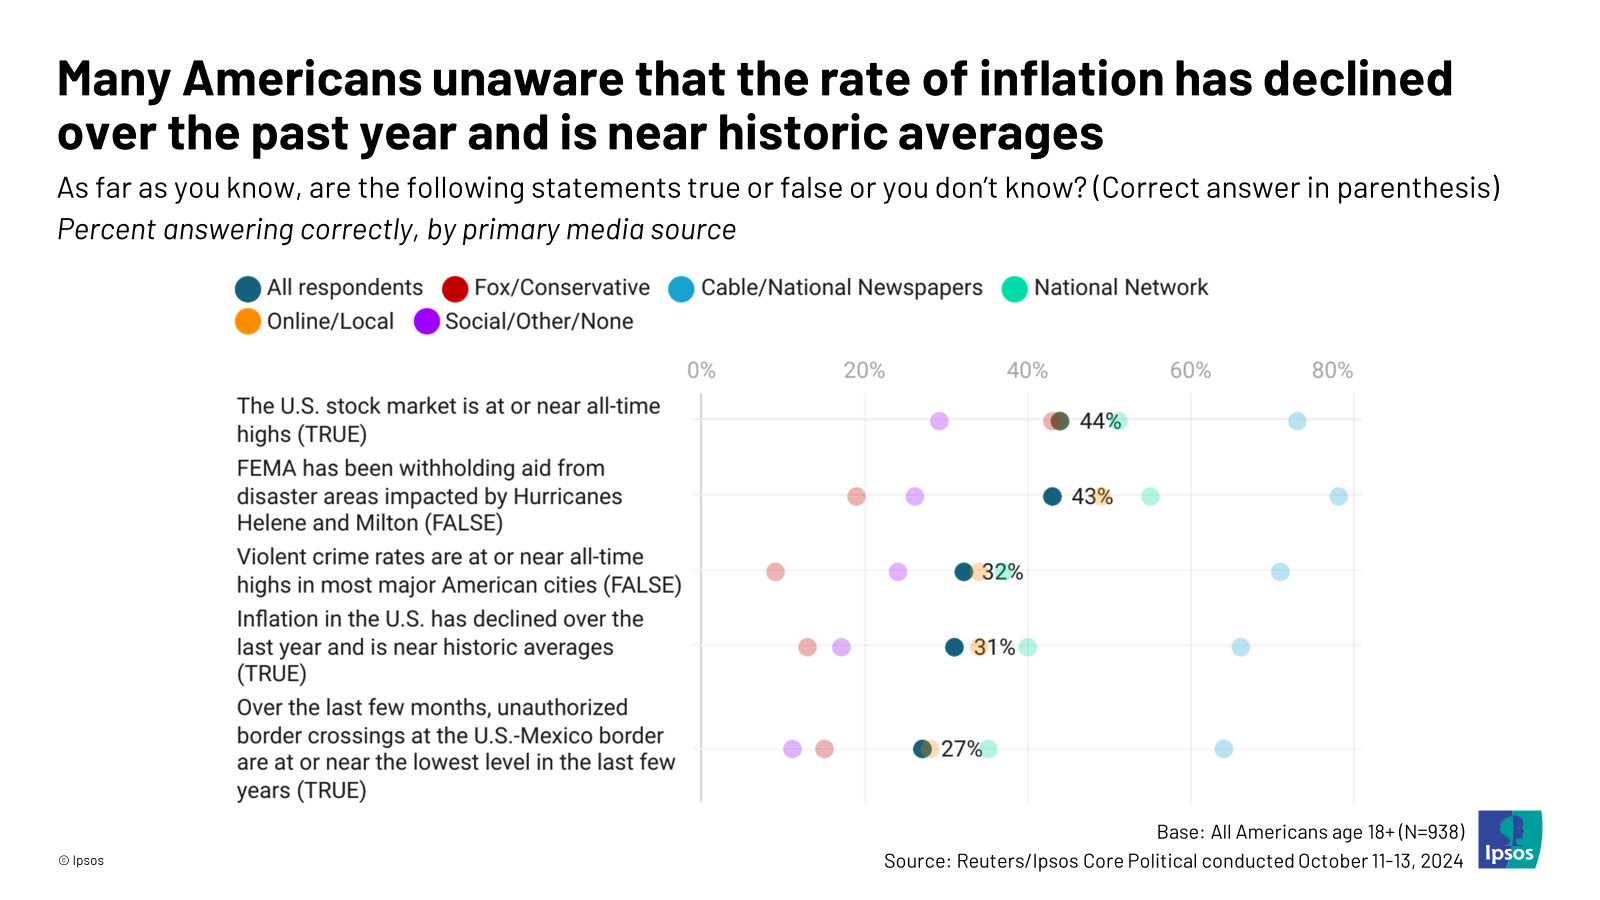
- Americans who primarily get their news from conservative media are more likely to incorrectly answer questions about the current state of the economy, immigration, and crime compared to Americans who get their news elsewhere.
- About one in three Americans (31%) correctly answer that inflation in the U.S. has declined over the last year and is near historic averages. Half of Americans answer this incorrectly (50%), while 17% of Americans say they don’t know. Just 13% of conservative media consumers answer this question correctly, while 66% of cable/national newspaper consumers answer this correctly.
- One in three Americans (32%) correctly answer that violent crime rates are NOT at or near all-time highs in most major American cities. Again, consumers of primary conservative media are less likely to answer this question correctly (9%), while consumers of cable/national newspapers are the most likely (71%) to answer correctly.
- One in four Americans (27%) correctly answer that over the last few months, unauthorized border crossings at the U.S.-Mexico border are at or near the lowest level in the last few years. The same pattern holds: 15% of conservative media consumers answer this correctly, compared to 64% of cable/national newspaper consumers who answer this incorrectly.
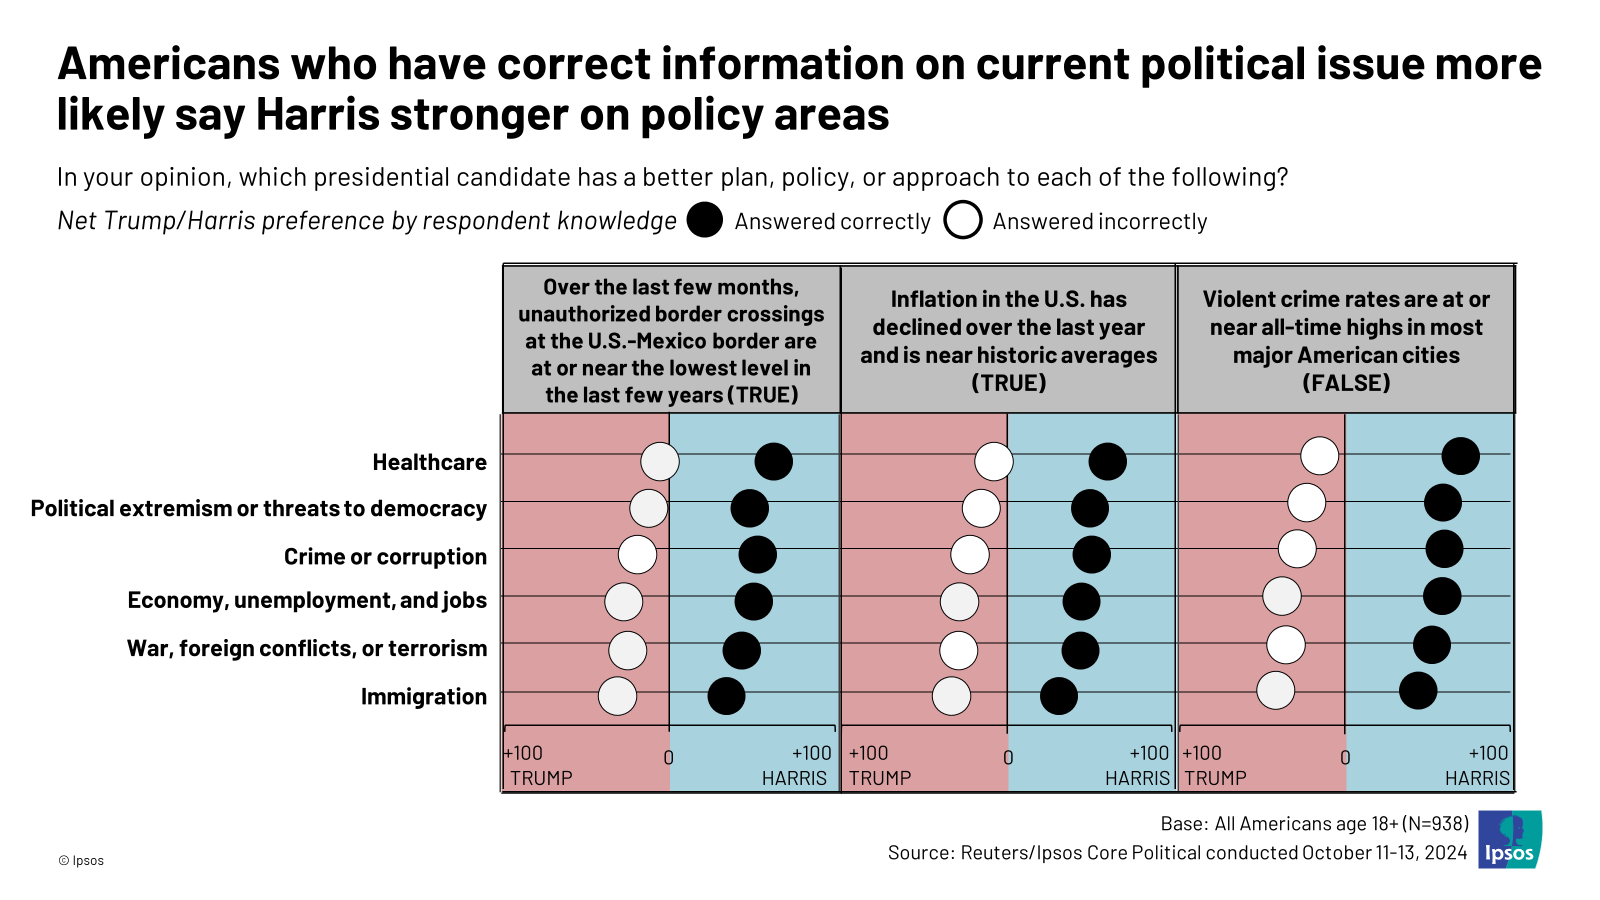
- Americans who answer questions correctly about current political issues are more likely to say Harris is stronger than Trump across policy areas. Americans who answer incorrectly are more likely to say Trump is stronger across policy areas.
- Americans who correctly answer that unauthorized border crossings at the U.S.-Mexico border are at or near the lowest level in the last few years are significantly more likely than those who answered incorrectly to say they prefer Harris’ policy approach when it comes to all policies asked, including immigration (Harris +36). Americans who answered incorrectly are more likely to prefer Trump’s approach to immigration (Trump +32).
- Americans who correctly identify that U.S. inflation has declined over the last year are more likely to prefer Harris’ policy approach to the economy than Trump’s (Harris +46). Conversely, Americans who answer incorrectly are more likely to say they prefer Trump’s policy plan for the economy (Trump +30).
- Americans who correctly answer that violent crime rates are not at or near all-time highs in most major cities are more likely to say they prefer Harris’ policy approach to crime or corruption (Harris +63). Americans who answer incorrectly are significantly more likely to prefer Trump’s policy approach to crime (Trump +29).
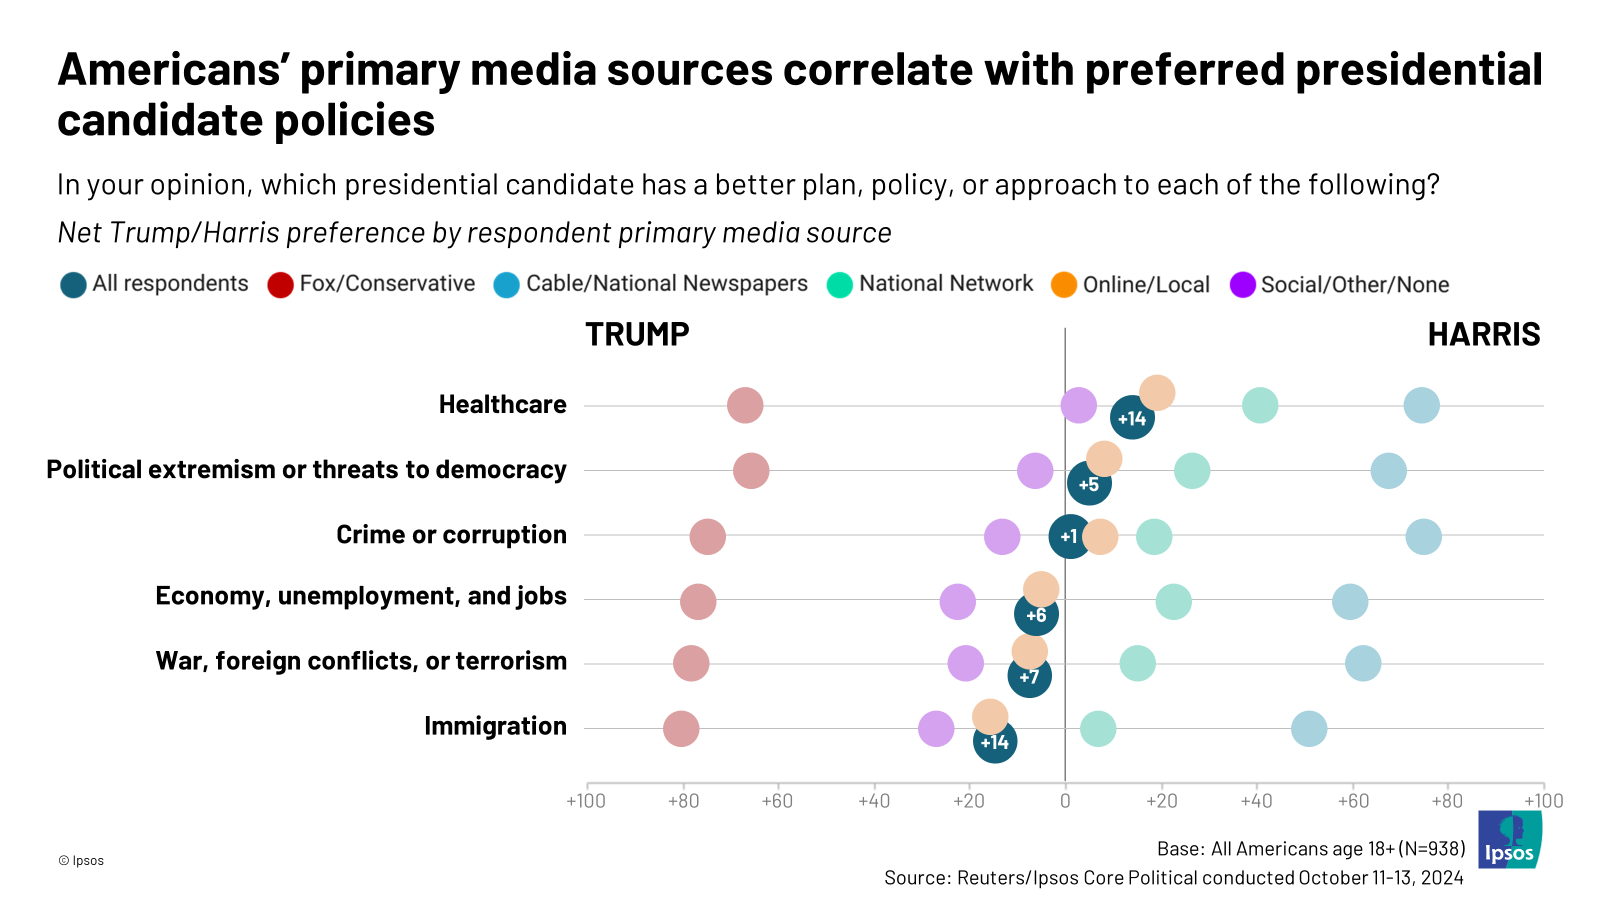
- Americans prefer Harris’ policies on healthcare and political extremism, but they prefer Trump’s policies on immigration, foreign conflicts, and the economy. Notably, Americans’ primary media sources correlate with their preferred presidential candidate policy approaches.
- When asked which presidential candidate has a better plan across policy areas, Americans favor Harris on healthcare (Harris +14) and political extremism (Harris +5). However, they favor Trump’s approach on immigration (Trump +14), foreign conflicts (Trump +7), and the economy (Trump +6).
- Conservative media consumers are more likely to prefer Trump’s approach over Harris’ approach across all policies areas asked. On the contrary, cable news and national newspaper consumers are more likely to prefer Harris’ approach across all policies asked.
- Americans who primarily consume online or local media are most likely to align with national averages on preferred presidential candidate positions across policies. Those who primarily consume social media, as well as those who primarily watch national networks, are closer to national averages of preferred presidential policy approaches than those who consume conservative media or cable/national newspapers.
- Americans who primarily consume social media lean slightly more towards Trump across policy areas than the national average, and Americans who primarily view national networks lean slightly more towards Harris.
- One in four Americans (26%) say they have seen grocery or gasoline costs go down in the last three months, while just under half say they have had to delay making a purchase because they didn’t have the money (45%). The poll finds significant variance by primary media source.
- Consumers of conservative media are less likely to say they have seen grocery or gasoline costs go down (9%) and are more likely to say they have had to delay making a purchase because they didn’t have the money (54%) in the last three months.
- On the other hand, consumers of cable and national newspapers are more likely to say they have seen grocery or gasoline costs go down (47%) and less likely to say they have had to delay making a purchase because they didn’t have the money (22%).
About the Study
This Ipsos poll was conducted October 11-13, 2024 by Ipsos using the probability-based KnowledgePanel®. This poll is based on a nationally representative probability sample of 938 general population adults aged 18 or older.
The margin of sampling error for this study is plus or minus 3.5 percentage points at the 95% confidence level, for results based on the entire sample of adults. The margin of sampling error takes into account the design effect, which was 1.27. The margin of sampling error is higher and varies for results based on other sub-samples. In our reporting of the findings, percentage points are rounded off to the nearest whole number. As a result, percentages in a given table column may total slightly higher or lower than 100%. In questions that permit multiple responses, columns may total substantially more than 100%, depending on the number of different responses offered by each respondent.
The survey was conducted using KnowledgePanel®, the largest and most well-established online probability-based panel that is representative of the adult U.S. population. Our recruitment process employs a scientifically developed addressed-based sampling methodology using the latest Delivery Sequence File of the USPS – a database with full coverage of all delivery points in the US. Households invited to join the panel are randomly selected from all available households in the U.S. Persons in the sampled households are invited to join and participate in the panel. Those selected who do not already have internet access are provided a tablet and internet connection at no cost to the panel member. Those who join the panel and who are selected to participate in a survey are sent a unique password-protected log-in used to complete surveys online. As a result of our recruitment and sampling methodologies, samples from KnowledgePanel® cover all households regardless of their phone or internet status and findings can be reported with a margin of sampling error and projected to the general population.
The data were weighted to adjust for gender by age, race/ethnicity, education, Census region, metropolitan status, household income, and 2020 presidential vote. The demographic benchmarks came from the 2023 March supplement of the U.S. Census Bureau’s Current Population Survey (CPS). The 2020 presidential vote benchmarks came from the Federal Election Commission.
- Gender (Male, Female) by Age (18–29, 30–44, 45-59 and 60+)
- Race/Hispanic Ethnicity (White Non-Hispanic, Black Non-Hispanic, Other, Non-Hispanic, Hispanic, 2+ Races, Non-Hispanic)/li>
- Education (Less than High School, High School, Some College, Bachelor degree, Master’s degree or above)
- Census Region (Northeast, Midwest, South, West)
- Metropolitan status (Metro, non-Metro)
- Household Income (Under $25,000, $25,000-$49,999, $50,000-$74,999, $75,000-$99,999, $100,000-$149,999, $150,000+)
- Vote Choice 2020 (Biden, Trump, Other/Did not vote/DK)
About Ipsos
Ipsos is one of the largest market research and polling companies globally, operating in 90 markets and employing over 18,000 people. Our passionately curious research professionals, analysts and scientists have built unique multi-specialist capabilities that provide true understanding and powerful insights into the actions, opinions and motivations of citizens, consumers, patients, customers or employees. Our 75 solutions are based on primary data from our surveys, social media monitoring, and qualitative or observational techniques.
Ipsos is listed on Eurolist – NYSE – Euronext. The company is part of the SBF 120 and the Mid-60 index and is eligible for the Deferred Settlement Service (SRD).
ISIN code FR0000073298, Reuters ISOS.PA, Bloomberg IPS:FP
www.ipsos.com