Further clues on voters' priorities in Scottish Election 2016
The second part of our poll for BBC Scotland gives further clues on voter priorities ahead of the Holyrood election in exactly one month from now. We asked voters to think about a broad range of issues, from the key devolved public services to the thorny matter of a further independence referendum.
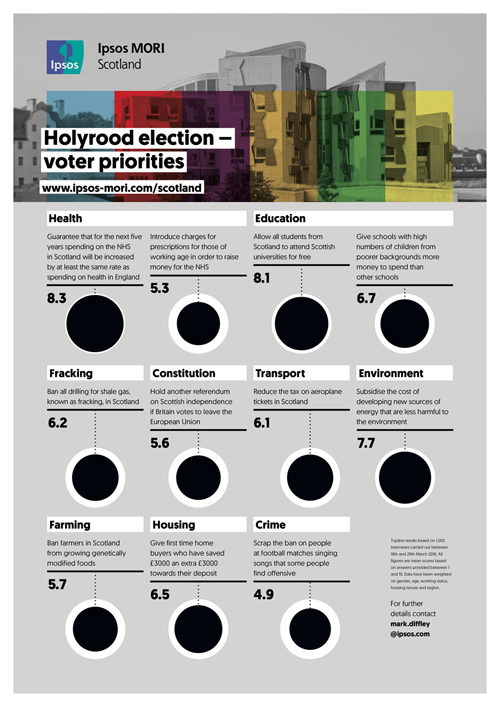
There is a real ‘don’t rock the boat’ feeling to the results. Voters do not want to see significant changes to the existing settlement around public spending and the key public services, albeit that proposals for additional help to children from poorer backgrounds and first-time buyers receive modest support.
From the full range of issues posed in the poll, the single most popular proposition is to guarantee that NHS spending in Scotland will be increased by at least the same rate as that in England, achieving a score of 8.3 out of 10 on average. Support for this measure is strikingly strong throughout the population; men and women, young and old, rich and poor all broadly support this proposal in equal measure.
There has been significant debate in recent years about the long-term affordability of some of the key decisions on public services. But as far as voters are concerned there is little appetite to change the status quo. Indeed, maintaining the principle of free higher education for Scottish students is seen as almost as important as high NHS spending, with an average score of 8.1. As one might expect, this proposal receives greater support from the young (8.8 among those aged 16-24) but actually has broad support throughout the population.
Voters are similarly sceptical about changing the current policy on prescription charges. With an average score of 5.3, the proposal to introduce prescription charges to those of working age is among the least popular. And it is interesting to note that there is not just naked self-interest in response to this proposal, since although it receives an average score of just 4.5 among those aged 16-24, those who are retired and would therefore not pay charge are not hugely in favour either, giving an average score of 5.5. All of which points again to a reluctance to be too radical with the current set up.
In policy proposal terms, the poll identifies a number of other potential areas where parties may find some traction in the coming weeks. The idea of giving additional funding to schools with high numbers of children from poorer backgrounds receives moderate support with an average score of 6.7 out of 10, while the proposal to give first-time buyers an additional £3,000 towards their deposit receives an average score of 6.5.
Both of these are a nod towards some support for innovative ideas for resolving issues of significant public concern but, in truth, do not receive the same levels of support as the core issues around the NHS and higher education.
Despite significant coverage of the possibility of a second independence referendum in the event of the UK voting to leave the EU, there is, at best, lukewarm support for such an eventuality among voters, with an average score of 5.6. Unlike many of the other issues in the poll, there is a significant disagreement among different sections of voters on this issue, broadly along the lines we observed during the 2014 referendum. Young people (7.2 among those aged 16-24) and those in Scotland’s most deprived communities (6.6) are significantly more in favour of a second referendum just as they were more likely to support a ‘Yes’ 18 months ago. But generally speaking this is seen as less of a priority than many of the other issues addressed in the poll.

Overall the poll points to the longstanding theory that we want gold standard public services without too much extra taxation. Now it’s over to the parties to persuade us that they are best placed to achieve that.
Technical Note Topline results based on 1,002 interviews carried out between 18th and 29th March 2016. All figures are mean scores based on answers provided between 1 and 10. Data have been weighted on gender, age, working status, housing tenure and region.


