Ipsos analysis shows Conservative support amongst ethnic minorities has remained low since Rishi Sunak became Prime Minister
- Ipsos study looks at voting intention and leader ratings amongst ethnic minority and white Britons since 1996.
- In Rishi Sunak’s first eight months as Prime Minister, 68% of ethnic minority voters told Ipsos they would support Labour – just 16% said they would support the Conservatives. In the period of 2022 leading up to Sunak becoming Prime Minister (January to October) Labour led by 61% to 14%.
- Labour has consistently held large leads with ethnic minority voters during the last few decades. Support for the Conservatives had reached 30% in the first half of 2016 – before falling sharply in the aftermath of Brexit and the 2017 general election.
A new study released by Ipsos explores voting intention and leader satisfaction ratings amongst ethnic minority and white Britons from 1996 to the first half of 2023. This is done by taking historic Ipsos Political Monitor polls and combining them into aggregated 6 monthly data points, therefore allowing for sufficient sample sizes of both groups for analysis purposes. A detailed report, with more on methodology and other findings (such as exploring the relationship between age and ethnicity) accompanies this press release.
Some key findings are summarised below.
Voting intention amongst ethnic minorities 1996-2023
- The below chart shows how Labour has enjoyed large leads amongst ethnic minority voters over time. During the most recent period from when Rishi Sunak became Prime Minister last year to June 2023, Labour led the Conservatives by 52 points (68% to 16%).
- The Conservatives had been as high as 30% among ethnic minority Britons under David Cameron in the first half of 2016 (the immediate period before the Brexit vote). They then fell sharply to 12% in the second half of 2017 – a time when support amongst ethnic minorities for Labour was particularly strong (77%) under Jeremy Corbyn. The Conservatives then recovered to 22% during the first half of 2021 but then fell again to a low of 11% in the first half of 2022 (the period leading up to Boris Johnson’s resignation).
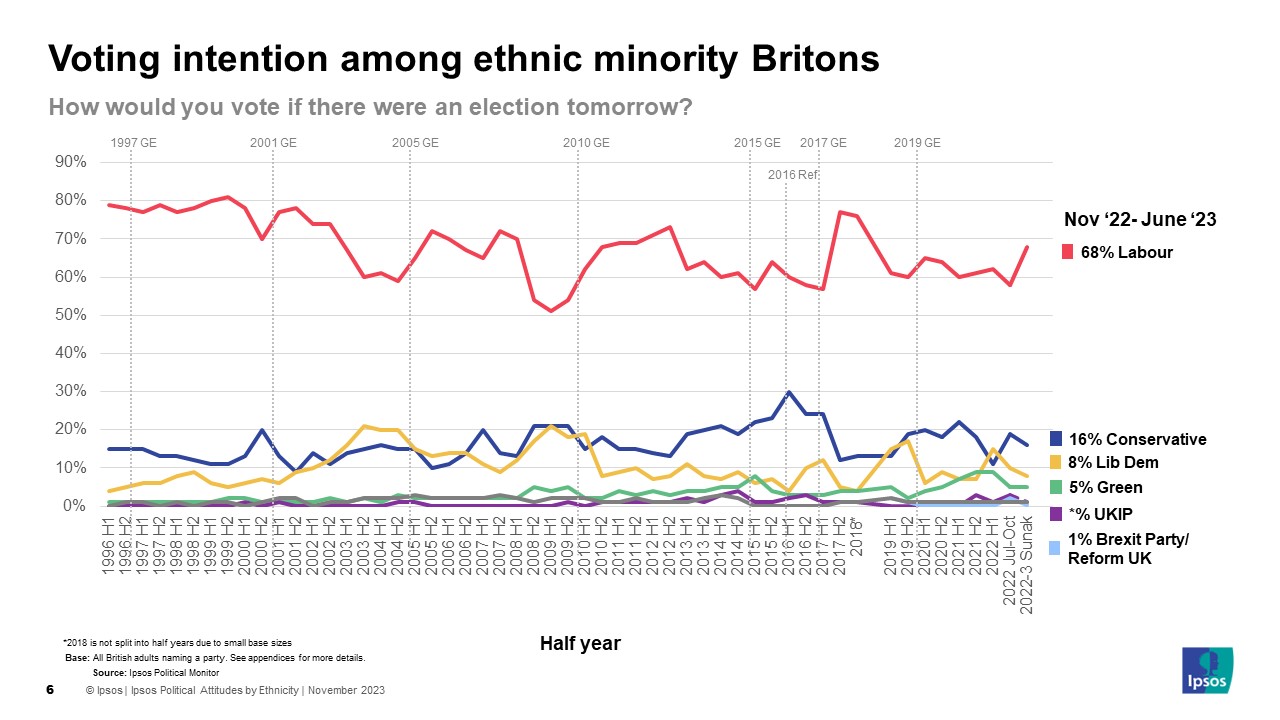
- There has been no significant improvement in the Conservatives' standing since Rishi Sunak took over as Prime Minister. In the period from November 2022 to June 2023 Labour were on 68% and the Conservatives 16%. In the period of 2022 before Rishi Sunak took over (January to October) the Conservatives were on 14% and Labour 61%.
Support for the Conservatives and Labour by ethnicity over time
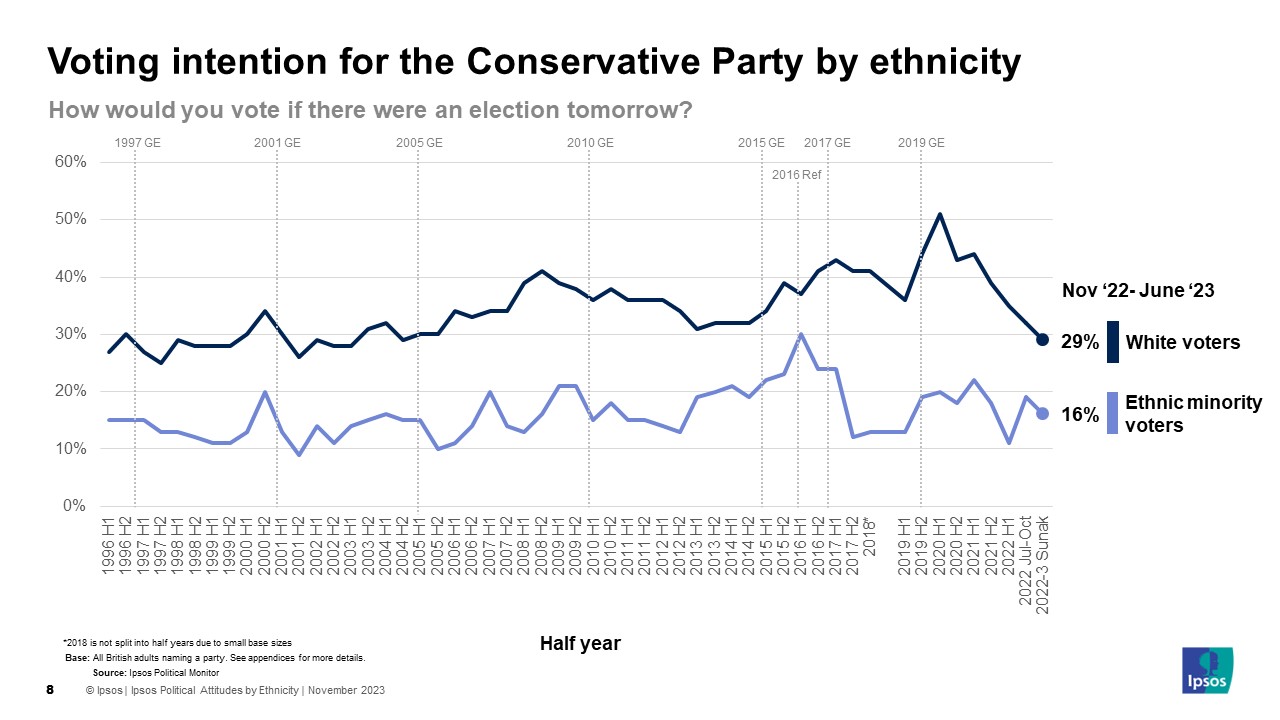
Since 1996 the Conservatives have consistently had a higher lead among white Britons than ethnic minority Britons. Since 2019 the gap has shown signs of narrowing, but that is mainly due to the Conservative vote share falling more quickly among white Britons than ethnic minority Britons. For example, in the first half of 2020 (the immediate aftermath of the 2019 General Election and the start of the Covid 19 pandemic) the Conservatives were on 51% with white voters but this has fallen steadily since, now standing at 29% in the first 8 months of Sunak’s tenure as PM. In the same period, they have fallen to 16% from 20% amongst ethnic minorities.
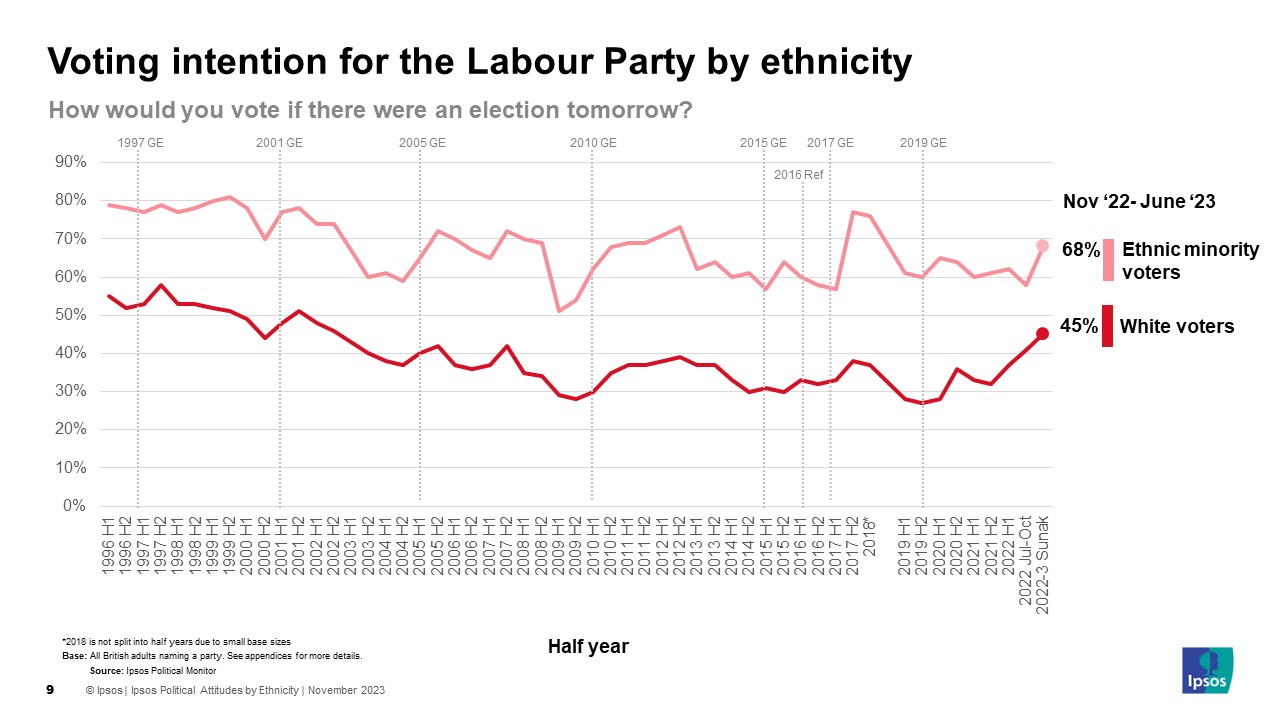
Labour has seen the opposite pattern, consistently doing better among ethnic minority rather than white voters. Again, since 2019 Labour's share has improved more among white Britons than among ethnic minority Britons. In the first half of 2020, Labour was on 28% with white voters whereas in the first 8 months of Sunak’s premiership they registered 45% (+17 points). Among ethnic minorities they are up just 3 points in that time (65% to 68%).
Satisfaction with Prime Ministers
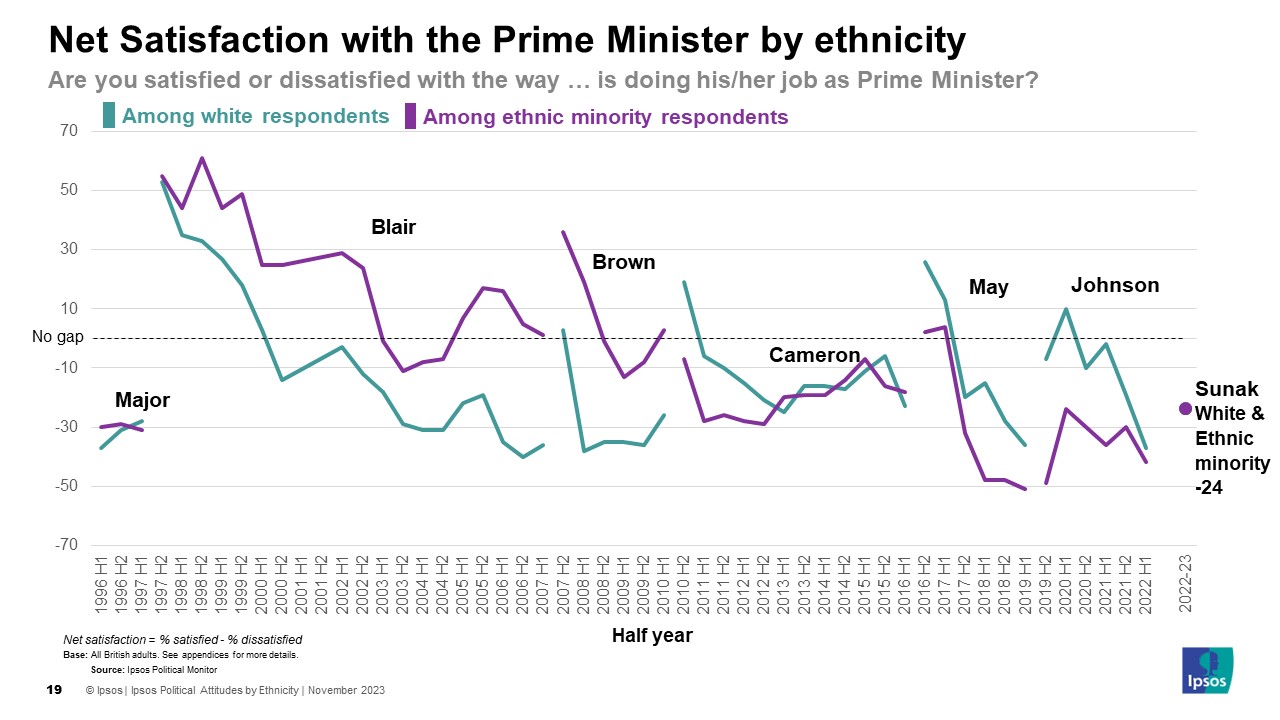
- The following charts show net satisfaction with Prime Ministers over time. Net satisfaction is calculated by subtracting the number of those dissatisfied with a Prime Minister’s performance from the number who are satisfied. Therefore, the higher the score, the more satisfied the public are with that Prime Minister’s performance.
- Tony Blair registered consistently high levels of net satisfaction amongst ethnic minorities, though this fell sharply during the period leading up to the Iraq war and during the initial invasion (falling from +29 in the first half of 2002 to -11 in the second half of 2003.
- Conservative Prime Ministers have typically registered weaker net satisfaction scores amongst ethnic minorities than Labour ones. Theresa May did register a net positive rating of +4 during the first half of 2017 but this fell sharply to -32 in the second half (after the 2017 General Election) and then to -48 in the first half of 2018.
- From that period onwards there was a fairly large ‘ethnicity gap’ in satisfaction ratings for May and Boris Johnson, whereby net satisfaction was higher with white Britons than with ethnic minorities.
- Theresa May’s final rating was with ethnic minorities was -51 during the first half of 2019 and Boris Johnson’s was -49 in the first half of 2022. For Johnson at this point the ‘ethnicity gap’ had all but vanished due to falling support with white Britons too.
- Rishi Sunak’s net satisfaction rating is the same for both white and ethnic minority Britons for the period November 2022 to June 2023, standing at -24. 29% of white Britons were satisfied with his performance during this period, 53% dissatisfied. 25% of ethnic minorities were satisfied and 49% dissatisfied.
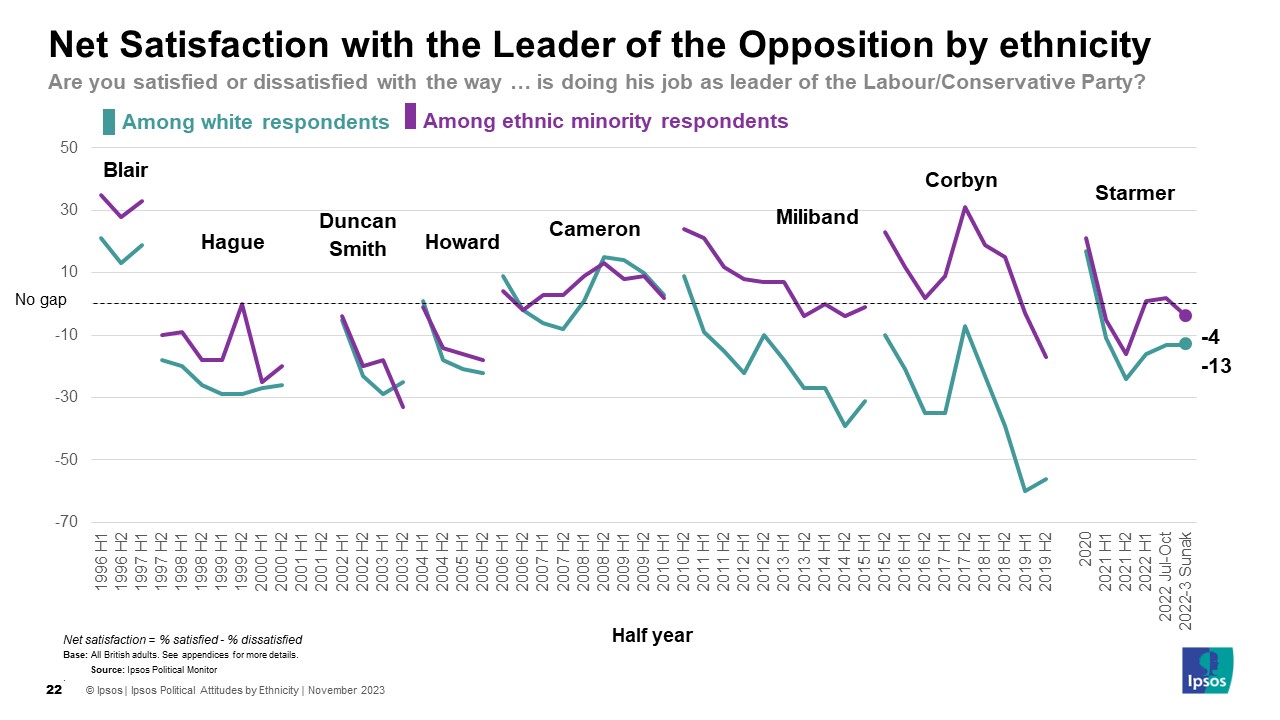
Net satisfaction with Leaders of the Opposition
- Net satisfaction towards Conservative leaders of the opposition amongst white and ethnic minority Britons have typically closely matched one another with David Cameron registering several net positive scores amongst ethnic minority Britons before assuming office in 2010.
- More recently support for Labour leaders of the opposition, Ed Miliband and Jeremy Corbyn, was greater amongst ethnic minorities than white Britons. Jeremy Corbyn reached a high of net satisfaction with ethnic minorities of +31 in the second half of 2017 (59% satisfied and 28% dissatisfaction). Tony Blair also broke the +30 mark in 1996 and 1997.
- Keir Starmer’s net satisfaction ratings have fallen with both white and ethnic minority Britons during his time as leader of the opposition but there is much less of an ‘ethnicity gap’ than recorded for his predecessors due to (generally) greater support amongst white Britons.
Commenting on the findings Ipsos Director of Politics Keiran Pedley said:
The purpose of this study is to help to fill an evidence gap that exists around ethnic minority voting behaviour in Britain over time. Care should be taken as sample sizes can be fairly low for individual data points, and so we should allow for a wider margin of error than usual. Even so, clear trends emerge, such as falling support for Labour among ethnic minorities around the time of the Iraq War or falling support for the Conservatives post Brexit and the 2017 general election. It is also clear that, as yet, that Rishi Sunak’s start as Prime Minister has made no material difference to Conservative support amongst ethnic minorities too – in fact, satisfaction with both him and his government is similarly low among both white and ethnic minority Britons. So whilst this data cannot answer all the questions we might have in this area, it does provide a useful starting point for further exploration.
Technical note
- This study uses historic Ipsos Political Monitor data to explore voting intention and leader satisfaction ratings amongst white Britons and ethnic minorities from 1996 to the first half of 2023. The full report is attached with this release.
- This was done by aggregating Ipsos polling every 6 months in that time period to build larger sample sizes for ethnic minorities at each data point.
- In practice, this means most years included in this study will have two data points e.g. 1996 H1 (half one) and H2. There are two exceptions. In 2018 there is just one data point due to fewer polls being conducted that year and therefore there being insufficient sample size to produce two waves of data.
- The most recent wave of data runs from November 2022 to June 2023. This reflects the time period from when Rishi Sunak took over as PM to the latest biannual data point of June this year. From now on we will return to producing data on a biannual basis as we have for the rest of this study.
- Note: On average, each wave of voting intention polling since 2010 includes approximately 350-450 ethnic minority respondents. This allows for comparisons between ethnic minority and white Britons as a whole but does not allow for analysis of subgroups within that. Margins of error will be wider than a standard opinion poll, and as with all polls may be subject to a range of different sources of error.


