SNP look set to be biggest party in upcoming election
With just over a week to go before the general election, our new poll for STV News suggests the SNP is on course to win most votes with the Conservatives and Labour in a close battle for second place.
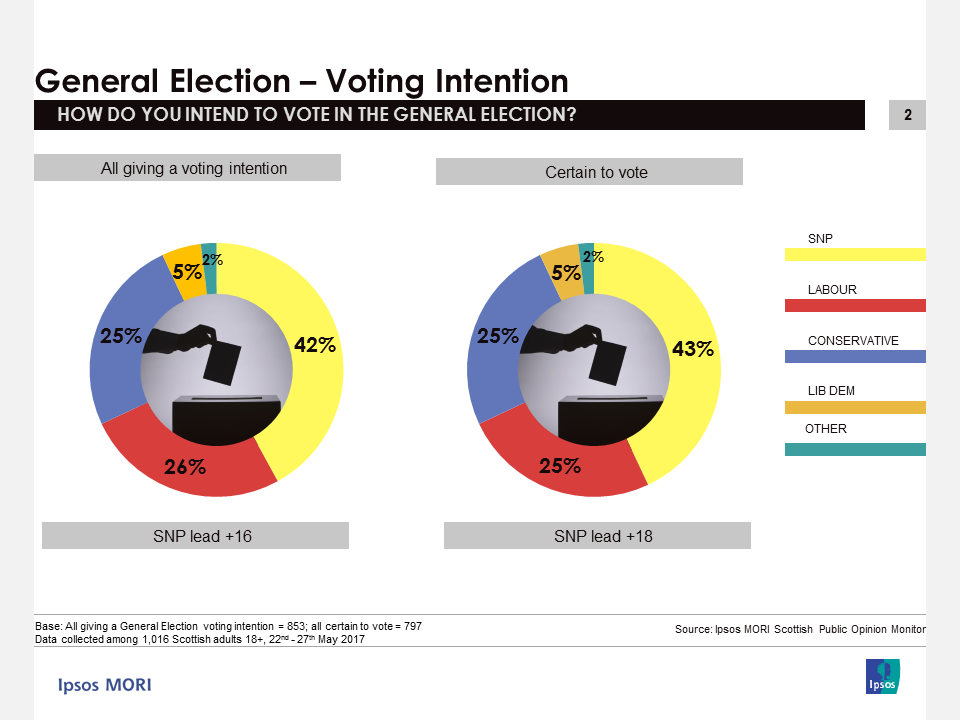
Among those who expressed a voting preference and who are very likely or certain to vote in the election on June 8th, 43% said they would vote for the SNP, while 25% back the Scottish Conservatives and 25% back Scottish Labour. Meanwhile 5% said they would vote for the Scottish Liberal Democrats while 1% would vote for the Scottish Greens and 1% for UKIP.

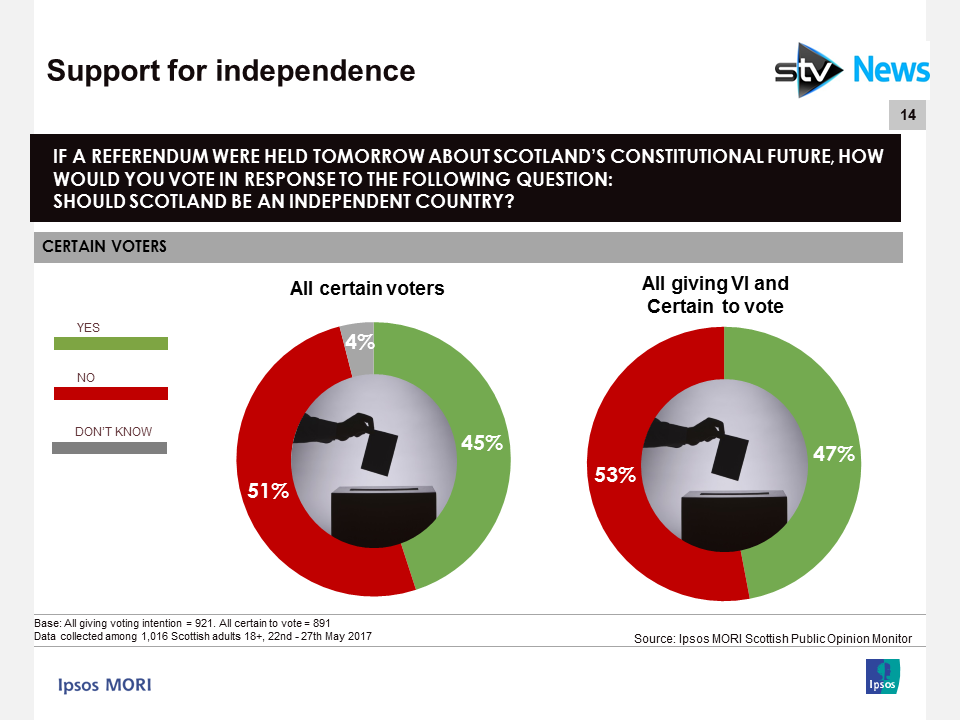
Elsewhere, among those who would be likely or certain to vote in an independence referendum, 47% said they would vote Yes (-3 pts from March) while 53% would vote No (+ 3 pts from March).

Mark Diffley, Director at Ipsos Scotland said:
Our poll for STV picks up some clear signals from voters. The SNP remains likely to win the most votes next week but is unlikely to repeat its unprecedented success of 2015. In vote number terms, the biggest beneficiaries appear to be the Conservatives whose share of the vote looks likely to increase significantly from its performance in 2015. They will be hoping that this translates into a significant number of seats turning from yellow to blue on June 8th. For Labour, the poll confirms some recovery, as seen in GB-wide surveys, where it may return to something approaching the result from 2015 in Scotland.
Technical details:
- Results are based on a survey of 1,016 respondents (adults aged 18+) conducted by telephone
- Fieldwork dates: 22nd May to 27th May 2017
- Data are weighted by: age, sex educational attainment and working status using census data; tenure and internet usage using Scottish Household Survey data; and public-private sector employment using Scottish Government Quarterly Public Sector Employment series data
- Certain to vote figures for the general election include those who say they are 9 or 10 out of 10 certain to vote in the general election and who voted in at least one of the EU Referendum, the 2015 General Election and the 2014 Independence Referendum
- Where results do not sum to 100%, this may be due to computer rounding, multiple responses, or the exclusion of “don’t know” categories
- Results are based on all respondents (1,016) unless otherwise stated


