Twelve shades of economic pessimism

The Chancellor gave his sober assessment of the economy earlier this month in his Autumn Statement and the public seems to have picked up on this. Our latest Economic Optimism Index (EOI) was -27 based on interviewing between 8-10 December, a 21 point fall in optimism compared with the -6 recorded in November.
Ipsos has measured EOI – the balance of those expecting the general condition of the economy to improve over the next twelve months less those who think it will get worse –since the late 1970s. This year, we have seen sustained pessimism; every one of the twelve EOI measures has been in negative territory to varying degrees ranging from November’s -6 to January’s -35. As Table 1 shows, however, the average EOI at -20 this year is marginally better than the -30 of 2011, and 2008’s -54.

To put this in historical context, the last ten years have seen an average EOI of -24. This compares with -9 during 1991 and 2001, and -16 during 1980 to 1990. More recently, EOI improved during Q3 this year; moving from -27 in August to -9 a month later, to -14 in October and -6 in November. This at a time when other Ipsos polls showed the public convinced that the Olympics had had a positive effect on the national mood and that it would help the economy. These sentiments were soon followed by the publication of positive GDP growth figures in October.
There is though a different frame for our EOI figures, a different way of looking at them. The index has always been calculated based on the proportion thinking the economy will improve less those thinking it will get worse; ‘bulls’ versus ‘bears’ in the parlance of the financial markets. But in times of growth it might be reasonable to consider those expecting the economy will ‘stay the same’ over the year head to be bulls. And at other times that same group could be thought of as bears – i.e. if things are bad economically, no change means they remain so.
Building on this, Table 2 below shows adjusted average EOIs for each quarter this year by factoring in the ‘stay the same’ group as described above. This has been done according to whether each monthly EOI measurement fell in a quarter which had positive or negative growth based on annual quarter-on-quarter GDP change figures from ONS; negative in every quarter this year (Q4 figures for 2012 have not yet been published).
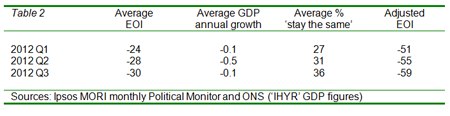
While Table 1 shows that the average EOI using the conventional calculation is stronger at the end of 2012 than it was this time last year, the public is gloomier this year based on adjustments taking into account the strength of the economy at the time we polled: -55 for Q1-Q3 this year compared to -1 for the same period in 2011.
Added to this, our recent ‘Austerity Tracker’ poll for the RSA found that while most of the public report having not been affected by cuts to public spending so far, 61% are either very or fairly concerned about the impact next year.
Whatever the precise extent, and shade, of pessimism now, our polls show it to be palpable and persistent. The Autumn Statement looks to have contributed to a re-adjustment of public views about the economy following a brief post-summer bounce. This means that, as well as GDP, unemployment, inflation and other macro indicators, consumer optimism is a vital sign to watch next year.
Ben Marshall is a Research Director at Ipsos. Follow him on twitter at @BenM_IM.