Driving Brand Equity
Brand equity is the intangible value a product or service offers its customers. One measure of brand equity is the additional value a customer would pay for a product or service from one company over another if both offered the same tangible features. For years, choice models have been used to measure the value of the brand. If we can capture the value of the tangible features of the product, and the sensitivity to price, we should be able to isolate the value of the brand's equity.
Brand equity, which is ideally forward looking, should not be confused with brand loyalty, which generally looks to the recent past. In purely behavioral terms, brand loyalty is the consistent purchase of a product over a given time period. For example, if nine out of ten purchases are for brand A, then we could say that the consumer is 90% loyal to brand A. This concept is much easier to measure in FMCG, but is often more challenging in durables, like personal computers, and services, like mobile phone service, where the purchase cycle is usually measured in years and not days.
What we do know is that there is a strong correlation between the number of brand loyals and the market share of a company. These loyals are often immune to competitive marketing efforts and are usually less price sensitive. If consumers are willing to pay more for the product, then that product must have higher brand equity to that consumer. Therefore, we can assume that loyalty is also closely correlated to brand equity. Looking at the drivers of brand equity may prove to be more actionable than understanding the drivers of loyalty. Inertia often becomes loyalty: "I always buy the same brand." While the marketer benefits financially from this loyalty, it is often difficult to determine how to influence this behavior.
The bottom line (at least to the finance folks) is really how much more money people will pay if the product is made by Brand A versus Brand B, if both brands offered the same set of product features. This dollar value can be used to compute the goodwill value of any brand. What the marketer wants to know is how to drive this value. Discrete choice models allow us to compute the utility for a number of tangible product attributes and the utility for price. As with most regression based analyses, there are two additional terms that are included in the model. These are the brand value and the error term for the model. Anything that drives product choice that is not captured by the tangible attributes and price should show up in the brand value. This is the best estimate of the intangible value the brand delivers.
Methodology
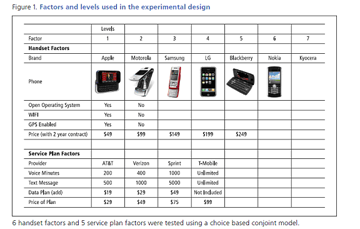
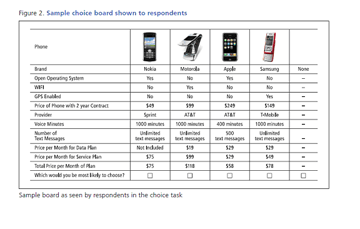
A choice based conjoint model was designed for the mobile phone market. Both manufacturers of mobile phone devices and providers of mobile phone service were included. Choice based conjoint (or discrete choice) has long been recognized as a useful tool in decomposing the value of the tangible attributes of a product or service into their relative part's worth of the whole offer. The value of the brand is what is not explained by the importance of the features tested, including the utility for price. The following set of factors and levels were included in the design. Using the factors and levels in Figure 1, an experimental design was created. For this design, any given phone brand (of the seven tested) could appear with any of the six unbranded form factors. The experimental design takes one level from each factor to create the total offer shown to respondents. Respondents were asked to select one of four phone/service plan options or none on twelve separate choice boards that included various options. An example choice board is included in Figure 2. The model was run using Hierarchal Bayes to compute individual level utilities for each of the factor levels. Once the utilities were computed, each respondent's brand utility was coded as above average, or below average.


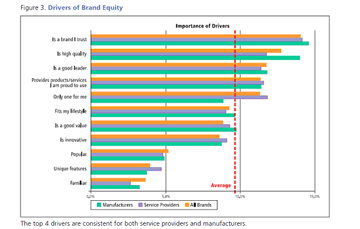
The drivers of brand utility were determined through the use of Penalty/Reward analysis. Penalty/Reward Analysis is unique in that instead of a single linear model (like ordinary least squares regression), we build two models. Below average brand utility is the source of penalties. Above average brand utility provides the estimates for the rewards. This approach is useful when you do not have a suitable normal distribution of the overall dependent variable, and suspect the drivers of above average brand utility may be different from the drivers of below average brand utility. The unique contribution of each driver attribute is measured by the increase in overall explanatory power of the driver attribute combinations that include the individual driver, versus those combinations that exclude that driver. This driver assessment is done separately for above-average utility groups (to get "rewards"), and below average utility groups (to get "penalties"). The total importance of a variable is simply measured as the sum of its penalty and reward (Figure 3).

Results
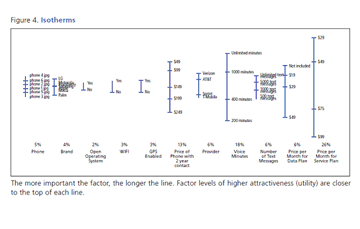
Figure 4 shows the relative importance of the attributes tested in the model. The combined price (price of service, data plan and handset) accounts for 53% of the decision to purchase in the category, with the cost of the monthly service being twice as important as the handset price (26%vs.13%). The tangible attributes tested account for another 37% (all attributes other than price and brand), leaving brand equity accounting for 10% of the importance in selecting a cell phone (4%) and mobile phone service provider (6%). What drives this equity?

The first pass of the driver analysis was done by combining both phone manufacturers and mobile phone service providers together in a single run. Trust is the number one driver of brand loyalty, followed by high quality.
Do the drivers of brand equity change if we run the analysis separately for manufacturers and service providers? For the most part, the top five drivers are essentially the same for both service providers and mobile phone manufacturers (Figure 3). While we have only looked at two categories (manufacturers and service providers), this does suggest that the drivers of equity would be consistent across a wider range of companies.
Now that we understand the drivers of equity, it should be possible to create an equity score for each brand in the study. Using the key drivers of equity, it is possible to create a weighted brand equity score at the respondent level. The ability to create a respondent level equity score allows for the ability to include this new variable in any subsequent modeling. Once the scores are computed, the average equity score for each brand is computed. This average equity score is highly correlated with stated market share (.913). Stated market share is computed by using the brand of phone owned, or the current provider of mobile phone service stated in the questionnaire.
Summary
Using the brand utility derived from a choice model data to determine the drivers of equity works well in the mobile phone category. Additional product categories would help support this model. The current algorithm for computing brand equity can easily be applied across categories without the need to conduct a new choice model. If we want to confirm that the key drivers of equity are consistent across categories, then we would need to design and execute a new choice model before running the driver analysis.

