How inflation is changing our behavior at the pump and the ATM
Since the early days of the pandemic, everyone has been wondering when we’d hit a new normal and what that would look like. From this editor’s perspective, you can make a case with this data that the new normal looks like today. Pretty much everything we trended is flat. The IPAC, Ipsos' measure of Americans' feelings about the virus, hasn’t moved a point in a month, when we last asked. Masking continues to fade. Appetite for new restrictions is flat despite cases being up 20% and well over 120,000 daily. Remember when the goal was to get under 100 a day – and that was attainable? Uh huh. But mostly we’ve figured out how to adjust and take all of this – including inflation in a lot of ways – in stride.
Here’s what we know today from the Ipsos Coronavirus Consumer Tracker:
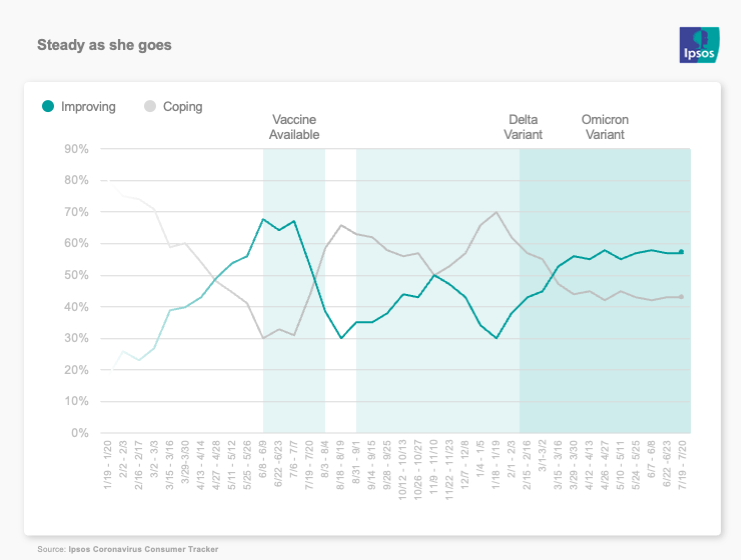
- The mood of the nation has really stabilized, as measured by the IPAC. There’s been essentially no movement in the last few months as we settle into a 57%/43% split on improving vs. coping. This bullet is still so true I’m leaving it from the last wave.
- About three in ten say they are frequently wearing a mask indoors, while now half say they are infrequently doing so.
- The high threat/low threat divide is steady at 23%/41%.
- The number of folks who say their spending is going to increase is steady, but the “decrease” camp seems to have shifted a few points into “no change.”
- One in four now say prices will never go back down. 36% say they will fall within the next six months.
Read on for data about: Pandemic-changed habits, inflation and fraud and more.
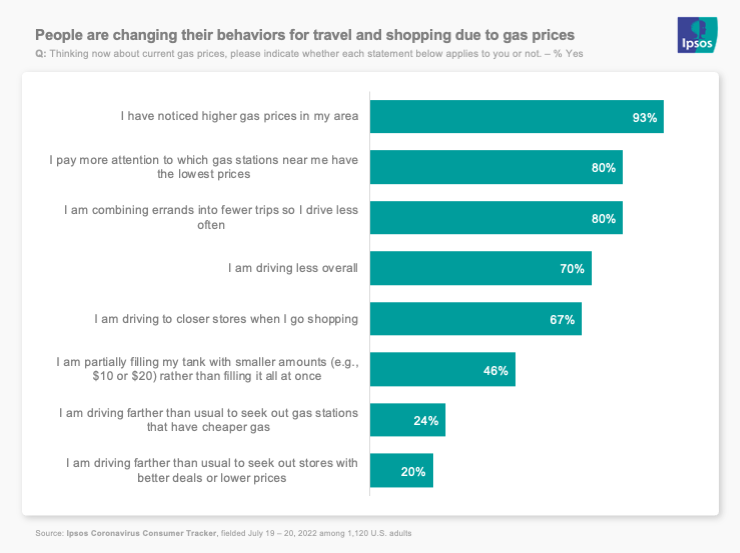
How are gas prices changing our behaviors?
Why we asked: We wanted to dig a little deeper on not just if high prices (coming down!) are changing things, but how.
What we found: Seven in ten are driving less overall. 80% are comparing prices at nearby stations. 80% are also combining errands to save on driving. 67% are shopping at closer stores, but 20% are driving further to find cheaper prices for the things they’re shopping for.
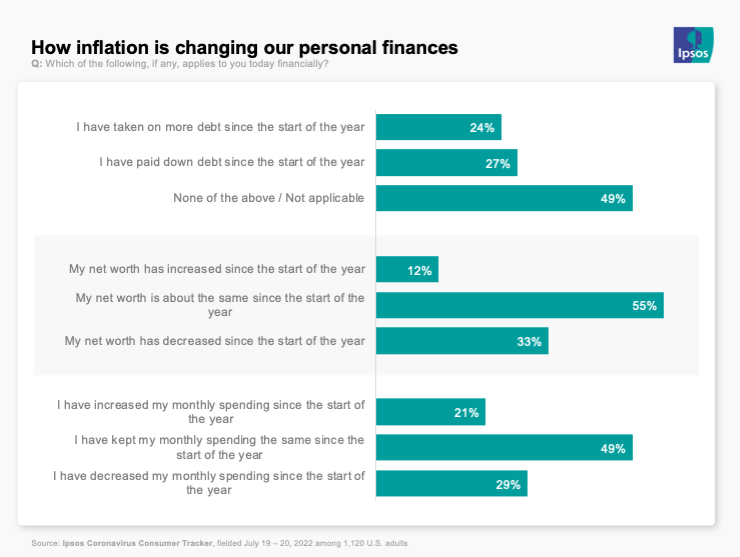
What has inflation changed
Why we asked: We wanted also to dig deeper into what has inflation changed for consumers?
What we found: About as many have taken on debt as reduced it, but most say their debt is unchanged. Many more say their net worth has decreased vs. increased (33% to 12%) but again, most say it hasn’t changed. Interestingly, more say they have decreased their monthly spend than increased it (29% to 21%) but again, half say it hasn’t changed.
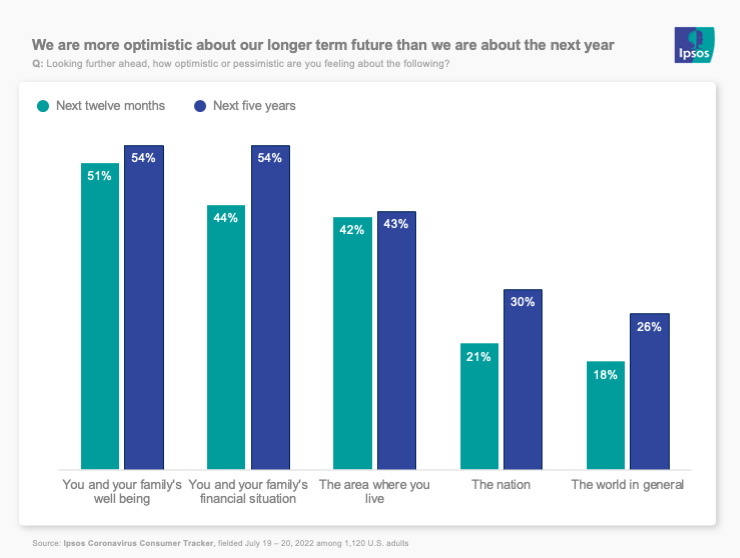
How optimistic are we?
Why we asked: We wanted to get a read on how we’re thinking about the near (1-year) and slightly less near (5-year) future for ourselves and our world.
What we found: About half of people feel optimistic for themselves in the next 12 months. But the further we get from there it starts to fall off: You and your family’s financial situation (44%); the area where you live (42%) the nation (21%) and the world (18%). Overall, we’re more optimistic about the 5-year horizon with a similar fall-off.
Signals
Here’s what we’re reading this week that has us thinking about the future.
- Tech worker backlash is a thing in China (via RestOfWorld)
- AI is better with humans (via MIT)
- GenZ not as interested in college (via FastCompany).
For complete toplines for all waves, please see the full data and methodology.