Opinion Polls: A continual improvement process
Political opinion polls have come under a high level of examination for decades, especially in the run-up to elections. And depending on how close they are to the outcome, opinions of polls themselves can swing between criticism and praise.
After the election of Joe Biden as US President in 2020, The Atlantic published an article entitled “The Polling Crisis is a Catastrophe for American Democracy”. Yet, in the wake of the 2019 British General Election, the BBC noted: “Opinion poll accuracy holds up”. So, in the end, what should we think?
This Ipsos Views paper tackles these questions head on, presenting an overview of the academic literature on the topic and explaining the practice of polling in different countries and contexts. The aim being to enable the reader to evaluate opinion polls for themselves.
Polls play a positive role in democracies, delivering honest and independent measurement of public opinion. Against the backdrop of recent election polling, this paper demonstrates how the methodologies on which political opinion polls are based has been developed from rigorous technical and scientific research.
After the experience of Brexit and the 2016 US elections, Ipsos conducted a thorough review of how it carries out polling and made some key decisions on how we will operate differently in light of these learnings. In this paper, we reflect on these recent experiences and consider how the practice of opinion polling is evolving in today’s volatile environment.
When the polls appear to have lacked precision, one popular assumption is that an opinion poll itself is an inappropriate methodology for capturing public opinion. In fact, the fault often lies with the practical methods implemented in a particular election. In other cases, the problem is not the method used itself, but the misinterpretation of a poll’s findings.
The paper also examines new methodologies and innovations in polling that Ipsos has adopted to improve the accuracy of its election predictions, as well as common challenges pollsters face and common pitfalls to watch out for.
Political opinion polls remain the public face of the research industry, and an important source of information for the media, the public, and decision-makers. This means that there is a great responsibility to get them right.
This paper has been revised and updated ahead of the French Presidential elections taking place in April of this year. For more information, see the dedicated home page for all Ipsos coverage here.
Ipsos conducts political opinion polling across the world, including for instance, polling ahead of the upcoming Australian, Brazilian and US midterm elections.
POLLING IN THE SPOTLIGHT
Political opinion polls come under great scrutiny in the run-up to elections, as we try to make sense of often changing and sometimes fragmenting political landscapes.
Depending on how close they are to the outcome, opinions of polls themselves can swing between criticism and praise. After the election of Joe Biden as US President in 2020, The Atlantic published an article entitled “The Polling Crisis is a Catastrophe for American Democracy”. Yet, in the wake of the 2019 British General Election, the BBC noted: “Opinion poll accuracy holds up”. So, in the end, what should we think?
THE PURPOSE OF THIS PAPER
Our aim here is not only to show that polls play a positive role in democracies as they deliver honest and independent measurement of public opinion, but also to demonstrate that these tools are based on strong scientific and technical bases. They can be challenged by open academic evaluations and are not “black box” types of methods. Of course, polls must be fairly evaluated without complacency after each election to identify possible imperfections in their design and execution – this feeds industry learnings and improvements. However, systematic criticism of polling undermines the value of their contribution and risks throwing the baby out with the bathwater.
The purpose of this paper is to offer an overview and a gateway to the considerable scientific literature on the matter. So, ultimately, anyone can form their own opinion on…opinion polls.
THE “PROBLEM”
Political opinion polls are the public face of the entire research industry and are an important source of information for the media, the public and decision-makers. So a good understanding of their contribution is necessary. Our view at Ipsos is that polls remain a vital tool for predicting election outcomes and, importantly, this is not only the perspective of polling professionals.
Electoral polling has been under a high level of scrutiny for decades, not only from the public but also from authorities and regulators. It has also been the subject of considerable independent academic work.
In the article “Improving election prediction internationally” published in the journal Science, Kennedy et al. analysed more than 500 elections, concluding that polls “provide a generally accurate representation of likely election outcomes and help us overcome the many biases associated with human ‘gut feelings’”.
Similarly, in a paper published online in Nature Human Behaviour, based on the analysis of 1,339 polls over 220 elections in 32 countries over a period of more than 70 years, Jennings and Wlezien show that there is no evidence that poll error has increased over time, and that the performance of polls in very recent elections is no exception. Declining response rates and growing variation in data collection mode, sampling and weighting protocols have had little effect on the performance of pre-election polls, at least when taken together. In fact, over the long term, polling in the last week of election campaigns has even tended to be more accurate, demonstrating the importance of using “fresh” data.
Despite their informational value, internationally, pre-election polls are also subject to criticism from government bodies who have sometimes restricted their practice and publication. Our international professional organisations (ESOMAR and WAPOR) regularly review the freedom to conduct opinion polls around the world.
The practice of opinion polls brings with it many challenges and over time it has faced countless questions about reliability. Here too there has been a significant academic focus, with a large number of publications on survey techniques. In recent years, a new academic field has developed called computational social research, which draws on the contribution of social networks and other digital sources. The academic publications often revolve around two points: collection methods (quality of panels, interviewing by telephone, via a PC, tablet or smartphone) and adjustment techniques.
Detailed information is available from many sources – it should be emphasised here that the quality of the panels and the validation of the responses obtained is closely monitored. For example, verification tools are used at many stages to eliminate suspect respondents (e.g. those who answer too quickly, or give the same score to all the questions) from the responses received.
Of course, no collection is perfect, but the information is collected using elaborate technical platforms and quality control methods. As for the adjustments, they are based on a rigorous statistical theory designed to improve the estimators. To find out more on this topic, the interested reader can refer to Pascal Ardilly’s book Les Techniques de Sondages. In the end, it is not the method in itself that should be criticised when the polls appear to have lacked precision, but rather the practical methods of implementation in a particular election.
Furthermore, on closer inspection a significant proportion of criticism of opinion polls can in fact be attributed to the interpretation of a poll’s findings, rather than the method itself. This has led to many efforts around the world to facilitate their accurate interpretation by the media and the public.
ESOMAR, the organisation that is the global voice for the research data and insights community, promotes professional ethical standards and has developed a Code of Conduct which all member organisations, including Ipsos, must comply with. This illustrates that the industry in general takes the task of conducting opinion and electoral polling very seriously.
Of course, errors made by single or multiple polling organisations can spark debates about the reliability or validity of methodologies used. So how is it possible for pollsters to get it so wrong? One of the popular but erroneous assumptions is that an opinion poll itself is not the most appropriate methodology to capture public opinion. This leads to the search for new, modern “miracle methods”.
When the sole use of these methods (e.g., social media analysis) show themselves to be successful in predicting outcomes in a given election, this gives further fuel to the questioning of so-called “traditional” methods and the work of established polling organisations.
But while these “miracle methods” can be right in isolated elections, more often than not they fall wide of the mark. The promise that the difficulties we face in measuring voting intention can be resolved by a new methodology or tool is, frankly, misleading. It means that – especially in times of uncertainty and disruption – the exercise of care, modesty and validation is often forgotten.
FINDING THE WAY FORWARD
The task in hand is not to replace polling that still gets it right in the vast majority of cases with an entirely different approach, but to adapt these approaches using extreme rigour in the implementation and incorporate fresh approaches as they are needed.
The discussion that sets pollsters as so-called supporters of “traditional methods” on one side and social media or Big Data analysts as keen promoters of “new methods” on the other side is an unhelpful categorisation and does not reflect the reality. We cannot fall into the trap of being overly reliant on evidence from isolated incidents. Instead, we need to think about implementing the right method in each context. This is why we frequently use social media analysis in addition to, and in combination with, polls and not as a substitution.
On this subject we can refer to the analysis made by Matthew Salganik, Professor of Sociology at Princeton University, in his book Bit by Bit: Social Research in the Digital Age: “the abundance of big data sources increases – not decreases – the value of surveys”.
This academic work describes well what we have also noticed in our professional experience – the combination of sources enables us to refine our findings. For instance, we may detect a certain dynamic in opinion by using social listening, which we can then incorporate into the design of surveys.
What is important is that the method is based on solid theoretical ground, and that it is implemented with enough care and precision. So, while problems and inaccuracies may occur, we can’t deny the foundations of the polling methods, and disposing of polling altogether would deprive us of a valuable means of predicting election outcomes.
After the experience of Brexit and the 2016 US elections, Ipsos conducted a thorough review of how it carries out polling and made some key decisions on how we will operate differently in light of these learnings. In this paper, we reflect on these recent experiences and consider how the practice of opinion polling is evolving in today’s volatile environment.
SOME RECENT HISTORY: POLLING IN THE REAR-VIEW MIRROR
Widely considered a year of disruptive political changes, 2016 saw the British public vote “Leave” in the EU referendum by a small margin, followed by the election of Donald Trump as President of the United States. In both cases, the outcomes were viewed as contrary to what the polls had been predicting.
Methods such as poll aggregation8 (which made Nate Silver successful in the 2012 US election) did not prove effective four years later and contributed to the general wave of “poll bashing” that then followed.
But, at the beginning of 2017, the accuracy of what the polls had predicted both for the Dutch election and for the Presidential election in France when compared to final results led commentators to switch back to praise of opinion polls. This turnaround was fuelled by several factors. First, the Dutch and the French election (first round) were considered difficult ones for polls because they featured a wide offer of political competitors combined with a truly evolutionary climate of opinion. Second, the stakes were high in terms of the “risk” of giving power to populist candidates.
The arrival of completely new candidates and parties to the political landscape represents a challenge. We saw this in the UK European elections in 2019. Predicting the results of this election was a difficult exercise given the methodological questions posed, brand new parties (one of whom topped the poll), low turnout, and a lot of uncertainty: 32% told us they might change their mind even in the very final days before the poll, much higher than we normally see in general elections. All of this was set against a very volatile political backdrop. However, Ipsos’ final poll was very accurate, getting the main story of the night right, with an average error of under one percentage point – the most accurate of all the final polls released by members of the UK British Polling Council. This level of accuracy continued at the subsequent December 2019 General Election.
One of the enduring roles of polls remains to ensure they are telling the story. At the 2021 Canadian federal elections, we showed the public and our clients how our research can not only predict what is going to happen but, more importantly, why it was happening.
It is the ability of Ipsos to tell this story of “why” and to provide a deeper understanding of the voter numbers that we can be particularly proud of, and this is what sets us apart and adds value to our client work.
THE CORONAVIRUS EXPERIENCE
The Covid-19 pandemic provides a current and powerful example of how polling can make a real contribution to telling the true story of what is happening on the ground. Opinion polls have built a nuanced understanding of the crisis, charting people’s experiences as the weeks became months. They have helped governments (and businesses) get closer to how perceptions are changing over time, by population sub-group and between countries. Public health agencies have been able to quantify information gaps and better understand motivations, for example on take-up of the coronavirus vaccines.
In Britain, the UK government drew on the principles of good research practice during its Covid-19 Home Testing programme which, by September 2020, had provided results based on a representative sample of 600,000 people from across England. This major study provided an accurate picture of how many people had the coronavirus at any one time.
CHOICES, CHOICES: METHODOLOGY MATTERS
Knowledge, experience and continual learnings are central to polling performance. Opinion surveys in general, and electoral polls in particular, were originally designed on scientific grounds and remain this way. But it is not enough to rest upon and replicate what has already been done. The market research industry must continue to invest in scientific progress and rigorous practice.
THE POLLSTER’S TOOLKIT
The choice of methods is the key question. Ipsos uses a variety of techniques precisely because there is not one unique method that can sufficiently answer all marketing and opinion research questions. Insights can be gained from behavioural economics, neuroscience, machine learning, Big Data, and social media. These techniques have become mainstream practice in many of our activities.
Each election needs to be taken as a special case and requires a rethink from A to Z in both survey design and execution. This could mean that some categories of voters require special attention and more sampling, that the likely voter model needs adaptation, or that postsurvey weighting requires different variables. In any specific election, there needs to be a special focus on where the real “high stakes” are.
Ipsos has moved from a rather localised process to a fully international approach, with the advantage of giving a greater number of observations of polls and election results than is available in a single country. A database of information from 500 elections around the world informs an Ipsos “base model” that allows us to compute probabilities of different parties’ success in elections. For each election, an expert outside the local team acts as an independent challenger or “referee” at all stages of the process. The referee makes sure the latest learnings are applied by the local team and any new lessons are captured and reported back.
Through this process, the cross-examination of methods lets us apply our international footprint and accumulated knowledge and expertise from elections around the world. But this is not to say that one size fits all. Quite the contrary, in fact. For example, the Australian system involves compulsory voting with a completely different parliamentary system to the United States.
But, through looking at this topic through a strictly international lens, we build a more rounded understanding of the dynamics involved in what we are trying to do. For example, large, young or urban populations might require different combinations of techniques; turnout may be quite volatile among certain groups, including the so-called “left-behinds”.
Techniques that can work well in some countries, such as polling aggregation, don’t work everywhere. So polling practitioners should draw on all available tools, including social media, in order to come up with the best approach every time.
THINGS TO WATCH OUT FOR
The potential sources of errors in polls are well-known and have been the subject of considerable expert discussion and academic scrutiny. They tend to relate to a handful of key issues such as:
Sampling: a fully representative spread of different types of voters (and non-voters) needs to be interviewed. Special attention needs to be dedicated to the sources and authenticity of respondents, making sure to eliminate bots or unreliable individuals. There has been considerable progress in the methods used to detect ineligible voters and in the deployment of countermeasures to ensure that these potential threats do not harm the validity of aggregated results.
Volatility is growing everywhere, creating an increased need to identify what is driving the dynamics of each campaign and to remain in field until the last possible moment.
The potential impact of non-response rates.
Questionnaire design including the perils of leading questions or not asking the right ones.
The data collection tools used (telephone, online or mobile for instance) and the impact of using them in combination.
The best way to analyse, weight and filter the results. For example, polling organisations weight the respondents once the survey is completed to compensate for some possible gaps with prior known information such as the results of past elections, or match the level of education in the sample with that of the population at large.
The 2020 US election provides a specific example of how context and election laws add complexity to election polling. In the US the global Covid-19 pandemic caused multiple states to expand vote by mail options to minimise potential exposure for voters. At the same time, one candidate and his party began making claims of fraud in postal voting and encouraged his supporters to vote in person. This caused the mode people used to vote to become highly correlated with who they planned to vote for. In the US example, vote by mail was decidedly Democratic while in-person voting was significantly more Republican. This meant that polls not only had to collect an accurate sample of the population, but also had to accurately reflect the distribution of vote by method.
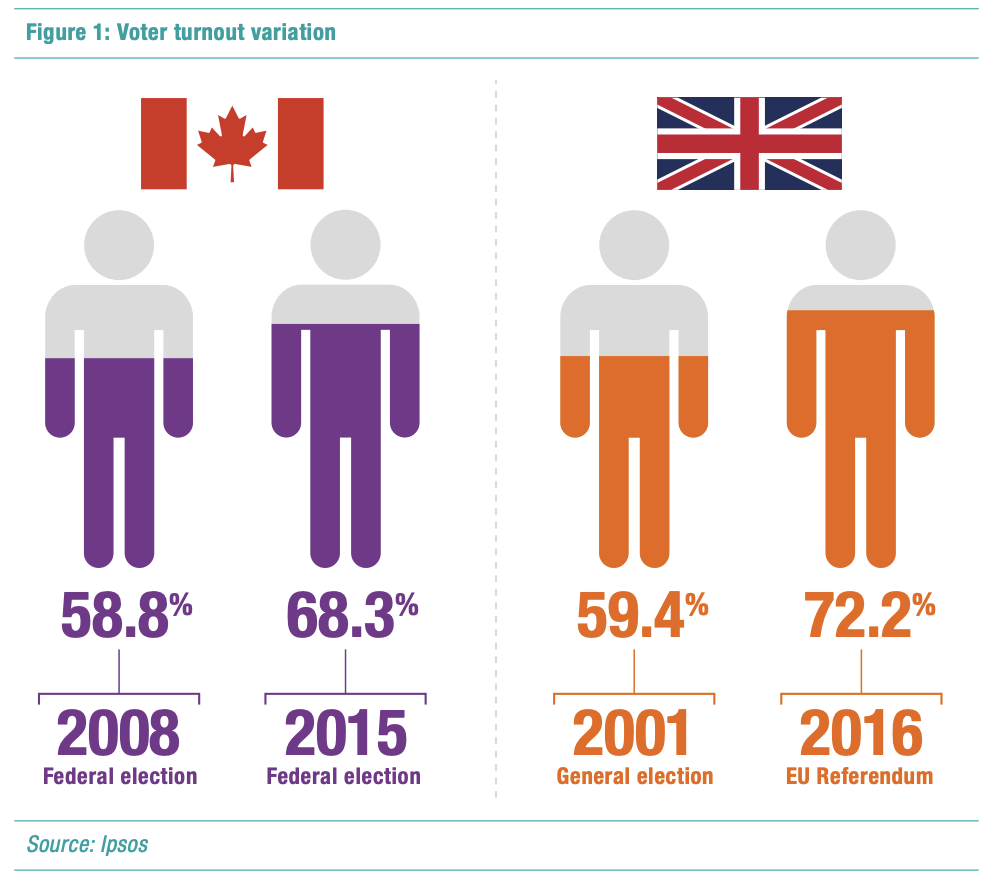
One central challenge today is to deploy the right elements of the polling methods to model voter turnout. Overall levels of turnout are not always stable between one election and another. For example, the proportion voting at recent Canadian federal elections ranged from 58.8% in 2008 to 68.3% in 2015. More recently, as the Canadian Federal Election of 2021 was conducted during the Covid-19 pandemic, many pundits were predicting the lowest-ever turnout. While it did drop from the 67% in 2019 (down to 62.5%) more Canadians voted than many anticipated – but Ipsos turnout modelling assisted in predicting an accurate turnout, and the implications on voter intentions. Elsewhere, in the UK, just 59.4% voted at the 2001 general election, the lowest since 1918. Fifteen years later, 72.2% of the British electorate cast their vote at the 2016 referendum on membership of the European Union.
What’s more, we often find that rises and falls in voter turnout are more pronounced among particular groups. Pollsters often find themselves struggling to identify which segments of the population are going to show up at a given time, in circumstances which are often very different to what came before. For example, participation of 18-24 year olds in Canadian federal elections rose 17 points between 2011 and 2015. The 2019 election then saw a four-point decline in turnout.
These are some of the methodological caveats that must be continually monitored and adapted on a case-by-case basis to uphold the highest levels of accuracy.
Empirically, various models have been developed to predict the turnout of the elections, derived from answers provided by respondents. In an increasingly volatile political environment, data must be collected as close as possible to election day to minimise the risk of missing lastminute switches in opinion.
Polling is becoming more complicated as voteswitching becomes more common. There is a great need for well-chosen samples and welldesigned questions that enable us to understand the attitudes and patterns that lie behind voting intention.
And, as voters become more complicated, multiple data sources and modes are needed to reduce coverage error.
“NEW” METHODOLOGIES AND INNOVATIONS
To estimate a national popular vote, you must accurately:
- Poll the total population of eligible voters;
- Estimate how many are going to show up;
- Estimate who is going to show up, i.e. the demographic and political composition of the voting public.
Emerging methods, such as Computational Social Intelligence, can be promising due to the fact that individuals now generate numeric traces of virtually everything they do.
This enables us to have a better understanding of the political situation which guides a better design of the polls.
But, to pick up on an earlier observation, there is also the temptation to say that outcomes predicted correctly by social media methods provide proof of validity. This is where claims are again misleading. The real validation is not to have been right once, but to have enough cases where the validity of your method can be observed. It is certainly a useful tool, but alone it is not enough and more work and testing needs to be done to establish the right approach.
INNOVATIONS IN POLLING
Sampling: We’ve found that diversity in sampling sources helps manage coverage error, as different profiles of voters have a tendency to respond to different data collection methods. Rolling samples and longitudinal panels also enable us to better understand volatility.
Behavioural science approach: In a given election context, elements such as the uncertainty surrounding a specific election and the emotions felt about the act of voting are now incorporated into Ipsos’ turnout modelling. This approach enables us to better apprehend emotions (e.g., will they ‘regret’ their decisions about whether to vote and which candidate to vote for). Capturing voters’ emotions is something pollsters cannot neglect anymore and drawing on perspectives from behavioural sciences is proving very productive.
A multi-indicator approach: Social Intelligence and Analytics tools allow us to detect signals of what is happening on the ground. Sometimes it may be about picking up early signs of change, which may be making little noise, at least initially. Other times there is a more obvious dynamic at play. Either way, social listening offers an invaluable wealth of information about campaign dynamics. Additionally, final population estimates of vote-share (such as the proportion of individuals voting Democrat or Republican), can be generated using multilevel modelling and machine learning techniques – leveraging individual data from polling and available aggregated data from small geographical areas. Such modelling is now well established as part of the pollster’s toolkit in many countries.
CONCLUSION
What causes confusion for many people outside the research industry is the sheer proliferation of polls before an election and the huge variance in the quality of the polling. These polls (some of them simply bogus) can skew forecasts along with public sentiment. The result: pollsters get a bad rap, and people become even less likely to talk to professional pollsters.
But, if you want to make some sense of the state of opinion at any moment in time, you absolutely need polls. As Prof. Salganik from Princeton University states, the proliferation of “big data sources increases - not decreases - the value of surveys”. This has led us to examine the role that artificial intelligence, social media listening and alternative approaches can play in pre-election research, as we search for more diverse solutions to assess people’s voting intent, turnout, and ultimately actual vote. There is a big responsibility to do this right.
This responsibility extends to taking a lead in encouraging good quality media reporting, particularly in today’s era of “Fake News”. However well-produced and accurate polling may be, it is impossible to control the way it is presented via both official media outlets and via the millions of online commentators on social media. Pollsters need to ensure they are always open and transparent about their methods, including setting out the limitations in terms of what the poll is not able to do.
This paper has been developed very much in this spirit and we are pleased to be involved in new initiatives, such as the #HighQualityReporting campaign recently launched in the UK, dedicated to better reporting of opinion polls and election data in the media.

![[WEBINAR] Know America at 250: Public Opinion Update](/sites/default/files/styles/list_item_image/public/ct/event/2026-07/250_0.png?itok=LxsH2NfS)
![[WEBINAR] Trust, Values & Growth Audiences: Innovation, Inclusion & Insights](/sites/default/files/styles/list_item_image/public/ct/event/2026-06/thumbnail-templates.png?itok=XcWEzpQn)