Muted support for recent immigration crackdowns
Washington DC, February 14, 2025—New NPR/Ipsos polling finds that the public is shifting toward a more restrictive stance towards immigration policy. A majority of Americans continue to say that immigrants are an important part of the American identity, though this sentiment has softened since 2018.
Still, less than half of Americans support the new administration’s immigration proposals and initiatives. Americans are largely hearing about the effects of these policies from local news and social media. Most believe there should be some cap on the level of immigration into the U.S., however they split on what that level should be.
Detailed findings:
When it comes to immigration policy, there has been a shift toward a more restrictive immigration policy over the past seven years.
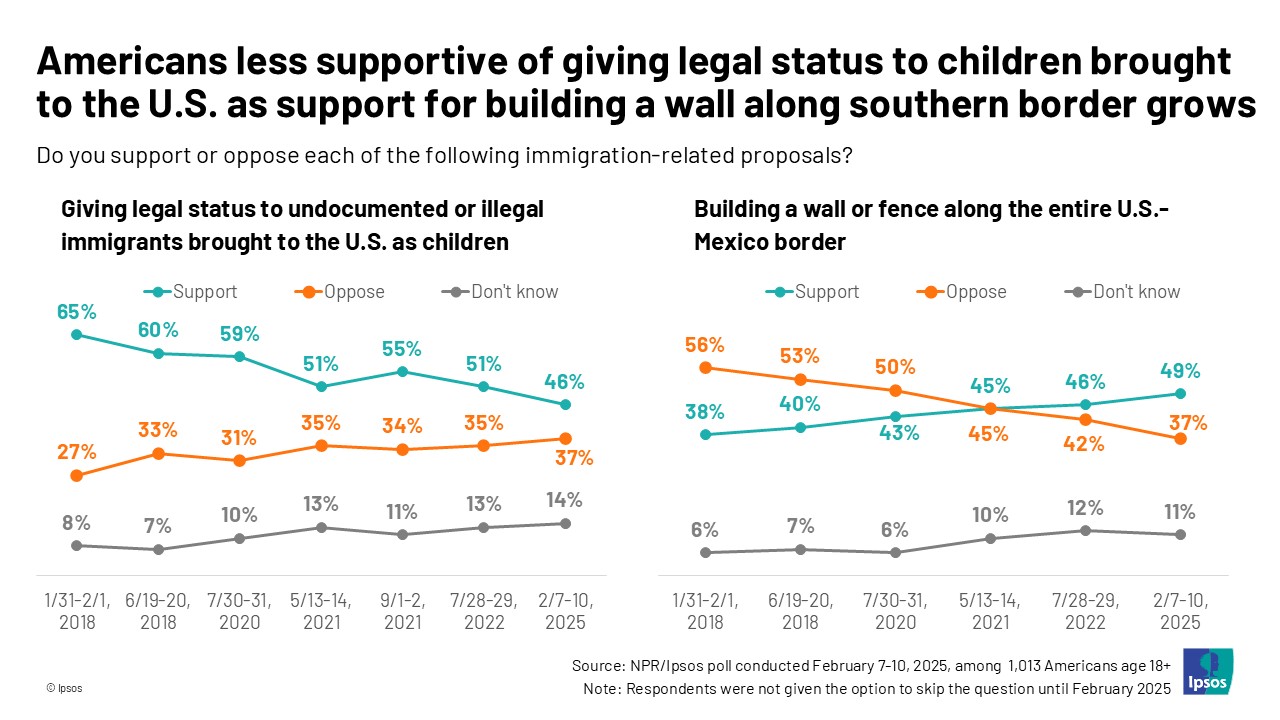
- About half of Americans (49%) support building a wall or fence along the entire U.S.-Mexico border.
- Since January 2018, support for this measure has risen 11 points. Opposition has fallen during that time too (56% oppose in January 2018 vs. 37% February 2025). However, over the same time, about twice as many Americans say they don’t know whether they support this proposal or not (6% in January 2018 vs. 11% February 2025).
- A plurality of Americans (46%) support giving legal status to undocumented or illegal immigrants brought to the U.S. as children, with more supporting rather than opposing this measure (37% oppose).
- However, support is down nearly 20-points since January 2018, when support was at 65%. More Americans now oppose this measure (27% oppose January 2018 vs. 37% in February 2025). The share of people who don’t know is also up (8% don’t know in January 2018 vs. 14% in February 2025).
- At the same time, a majority (61%) say that immigrants are “an important part of our American identity,” though this sentiment has softened since January 2018, when 75% agreed with that statement.
No new immigrations proposals win majority support from the public, with Americans divided between feeling these immigration restrictions go too far or don’t go far enough.
- About one in three (32%) say the recent immigration restrictions enacted in the past few weeks go too far. About three in ten (29%) say they do not go far enough, while 16% say they are about right and one in five (20%) don’t know.
- Americans are divided on the question of allowing local law enforcement to arrest and detain immigrants without legal status (48% support, 39% oppose, 11% don’t know), the newest proposal that gets closest to majority support.
- The most unpopular initiatives tested include giving ICE the ability to arrest immigrants in formerly protected spaces like schools, churches, and hospitals (35% support), canceling visas for students who participated in pro-Palestine protests, forcing them to leave the U.S. (33%), and ending birthright citizenship (31%). A majority oppose ending birthright citizenship and giving ICE the ability to arrest immigrants in protected spaces (54% oppose, each).
- Partisanship mediates opinion on nearly all of these policies.
While Americans are split on whether these new immigration restrictions are appropriate, many say they are hearing about their enactment on the news or social media, with few personally seeing or hearing about this.
- About half of Americans (48%) say they have heard about the impacts of the new administration’s immigration policies in their local community through the local news, with little difference between Democrats, Republicans, and independents.
- Almost an equal share (45%) say they have heard about the impacts of these new policies on social media. More Democrats (51%) and Republicans (49%) have seen or heard these impacts on social media over independent Americans (40%).
- Three in ten (31%) have also heard about specific impacts of the new administration’s immigration policies through family and friends. One in ten (9%) Americans say they have witnessed the specific impacts in person, with Democrats being more likely to say this than independents and Republicans (15% vs. 9% and 4%, respectively).
- One in three Americans (35%) say they have a friend who was born outside the U.S., up from one in four (25%) who said this in May 2021. Democrats and independents are more likely than Republicans to have a friend who was born outside of the U.S. (41% of independents, 37% of Democrats vs. 28% of Republicans).
Americans are divided on what the right amount of immigration into the United States looks like, but most Americans fall somewhere in the middle.
- Very few Americans (14%) think there should no cap or limit on the number of immigrants allowed into the U.S., while very few (10%) think the U.S. should allow hardly any immigrants.
- Most think there should be some cap or limit on immigration but are divided on whether the cap is at the right place currently (17%), if it should be higher than it is now (12%), or if it should be lower than it is now (24%).
About the Study
This NPR/Ipsos poll was conducted by Ipsos from February 7 to February 10, 2025, using the probability-based KnowledgePanel®. This poll is based on a nationally representative probability sample of 1,013 adults age 18 or older. The sample includes 263 Republicans, 322 Democrats, and 306 independents.
The survey was conducted using KnowledgePanel, the largest and most well-established online probability-based panel that is representative of the adult U.S. population. Our recruitment process employs a scientifically developed addressed-based sampling methodology using the latest Delivery Sequence File of the USPS – a database with full coverage of all delivery points in the U.S. Households invited to join the panel are randomly selected from all available households in the U.S. Persons in the sampled households are invited to join and participate in the panel. Those selected who do not already have internet access are provided a tablet and internet connection at no cost to the panel member. Those who join the panel and who are selected to participate in a survey are sent a unique password-protected log-in used to complete surveys online. As a result of our recruitment and sampling methodologies, samples from KnowledgePanel cover all households regardless of their phone or internet status and findings can be reported with a margin of sampling error and projected to the general population.
The data for the total sample were weighted to adjust for gender by age, race/ethnicity, education, Census region, metropolitan status, and household income. The demographic benchmarks came from the 2024 March Supplement of the Current Population Survey (CPS). The 2024 presidential vote choice benchmarks came from the federal elections 2024 election results for the U.S. President.
- Gender (Male, Female) by Age (18–29, 30–44, 45-59 and 60+)
- Race/Hispanic Ethnicity (White Non-Hispanic, Black Non-Hispanic, Other, Non-Hispanic, Hispanic, 2+ Races, Non-Hispanic)
- Education (Less than High School, High School, Some College, Bachelor’s degree, Master’s degree or higher)
- Census Region (Northeast, Midwest, South, West)
- Metropolitan status (Metro, non-Metro)
- Household Income (Under $25,000, $25,000-$49,999, $50,000-$74,999, $75,000-$99,999, $100,000-$149,999, $150,000+)
- 2024 Presidential Election Vote (Donald Trump, Kamala Harris, Other, Did not vote)
The margin of sampling error is plus or minus 3.8 percentage points at the 95% confidence level, for results based on the entire sample of adults. The margin of sampling error takes into account the design effect, which was 1.49. For Republicans, the margin of sampling error is plus or minus 6.7 percentage points, and the design effect is 1.24. For Democrats, the margin of sampling error is plus or minus 6.9 percentage points, and the design effect is 1.59. For independents, the margin of sampling error is plus or minus 7.0 percentage points, and the design effect is 1.55.
The margin of sampling error is higher and varies for results based on sub-samples. In our reporting of the findings, percentage points are rounded off to the nearest whole number. As a result, percentages in a given table column may total slightly higher or lower than 100%. In questions that permit multiple responses, columns may total substantially more than 100%, depending on the number of different responses offered by each respondent.
For more information on this news release, please contact:
Chris Jackson
Senior Vice President, US
Public Affairs
+1 202 420-2025
[email protected]
Mallory Newall
Vice President, US
Public Affairs
+1 202 374-2613
[email protected]
About Ipsos
Ipsos is the world’s third largest Insights and Analytics company, present in 90 markets and employing more than 18,000 people.
Our passionately curious research professionals, analysts and scientists have built unique multi-specialist capabilities that provide true understanding and powerful insights into the actions, opinions and motivations of citizens, consumers, patients, customers or employees. We serve more than 5000 clients across the world with 75 business solutions.
Founded in France in 1975, Ipsos is listed on the Euronext Paris since July 1st, 1999. The company is part of the SBF 120 and the Mid-60 index and is eligible for the Deferred Settlement Service (SRD).
ISIN code FR0000073298, Reuters ISOS.PA, Bloomberg IPS:FP www.ipsos.com