Americans support extending some tax cuts in House budget – but not for the wealthy or corporations
Washington DC, June 17 – A new Washington Post/Ipsos poll finds that Americans are generally unfamiliar with the One Big Beautiful Bill Act passed by the U.S. House of Representatives but are more likely to oppose the bill than support the bill. The poll also finds that partisans are deeply divided on key provisions of the bill, with the exception of increasing the annual child tax credit for parents, which draws majority support on both sides of the political aisle. Americans also support extending the 2017 federal income tax cuts for individuals with incomes under $100k and married couples with incomes under $200k, but support is weaker for extending cuts for wealthier Americans and business corporations.
To read more from the Washington Post, click here.
Key Findings
1. Many Americans are unfamiliar with the One Big Beautiful Act. However, more say they oppose rather than support the bill, while one in three say they have no opinion.
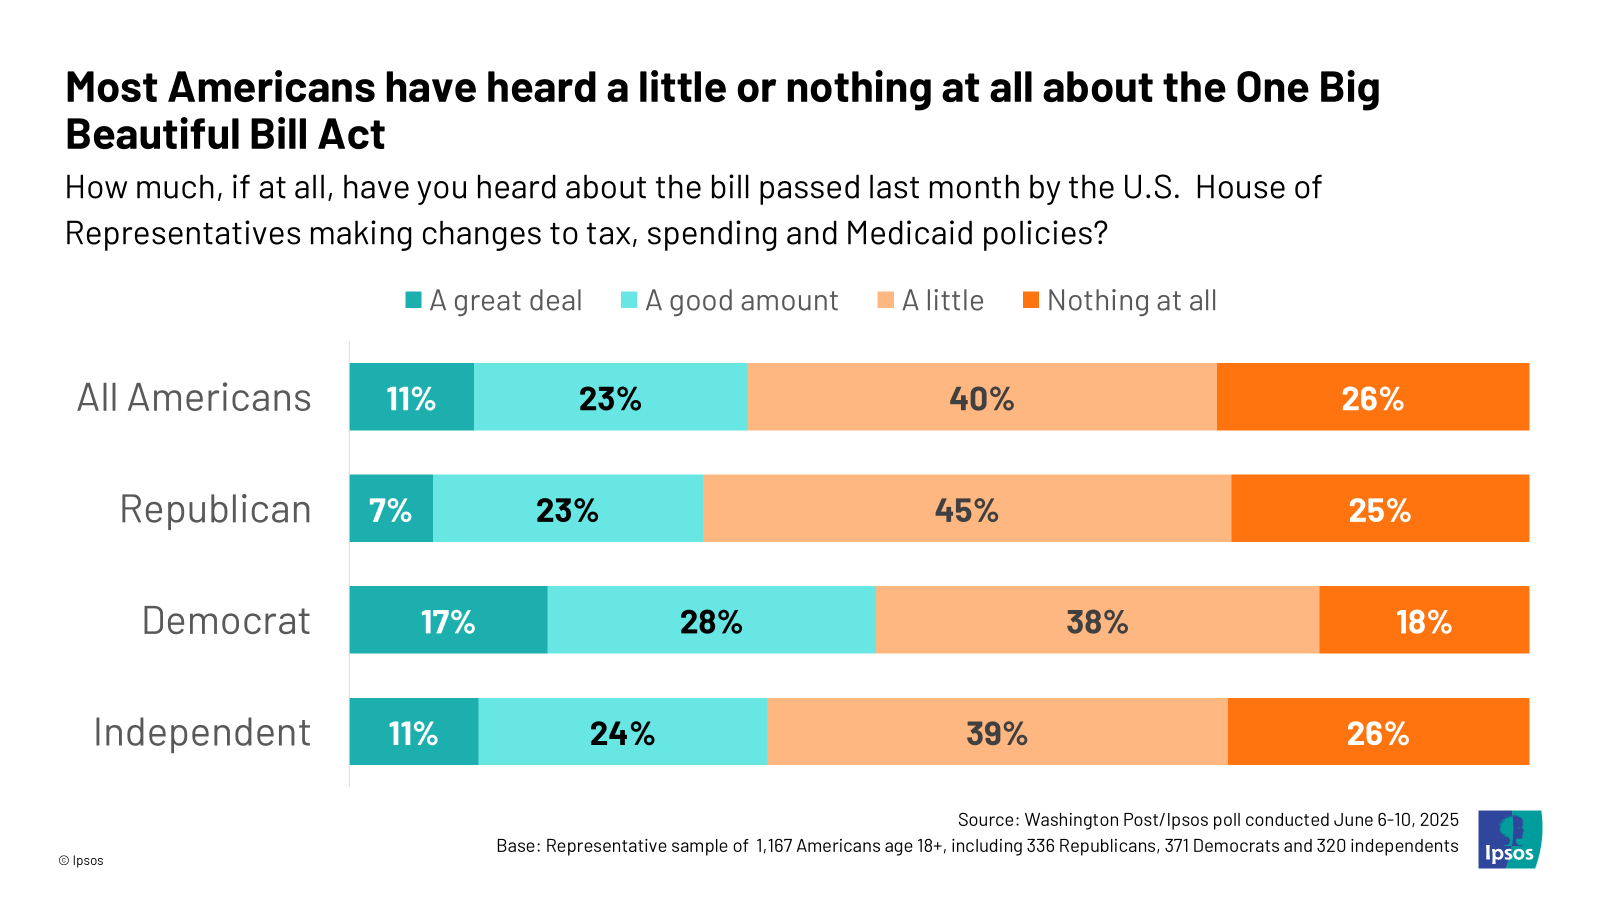
- Americans are generally not familiar with the bill passed last month by the U.S. House of Representatives that would make changes to tax, spending and Medicaid policies. One in four (26%) say they have heard nothing at all about this bill and 40% say they have heard a little about the bill. Just 11% say they have heard a great deal about the bill; 23% say they have heard a good amount.
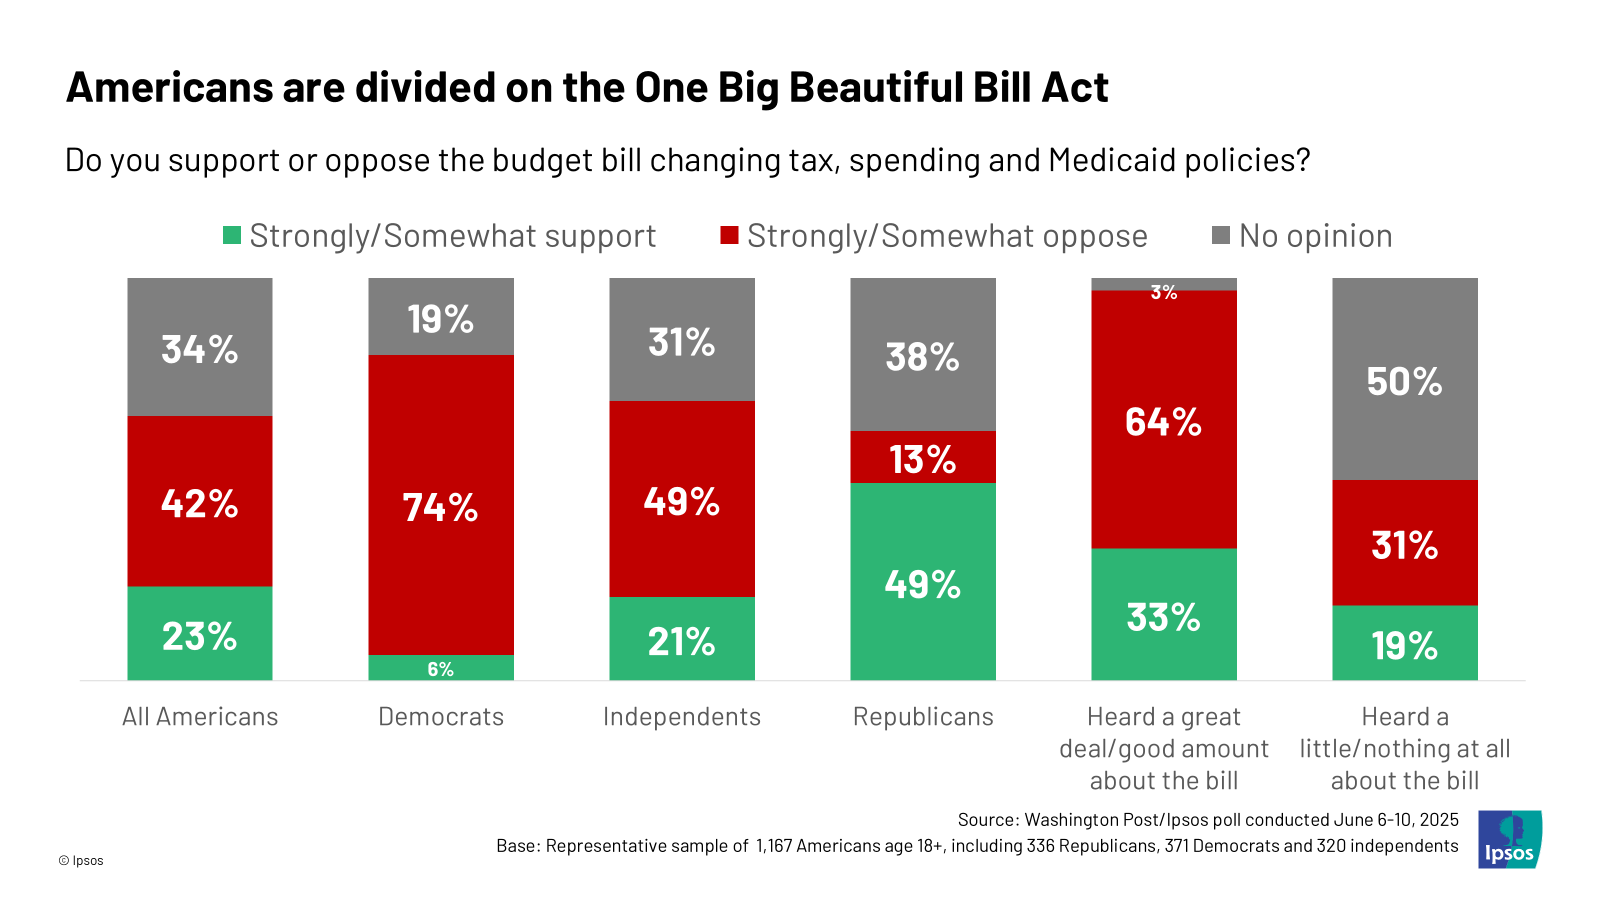
- Support for the bill is mixed. Americans are more likely to say they oppose the bill (42%) than support the bill (23%), though a significant minority (34%) say they have no opinion on the bill.
- Partisans are deeply divided on the bill. Half of Republicans support the bill (49%), compared to 6% of Democrats and 21% of independents that support the bill. Notably, sizable minorities of Republicans (38%), independents (31%) and Democrats (19%) say they have no opinion on the bill.
- Americans that have heard a great deal or a good amount about the bill are more likely to oppose the bill (33% support, 64% oppose). That said, Democrats are slightly more likely to say they have heard a great deal or a good amount about the bill (45%) compared to Republicans (30%) and independents (35%).
2. Americans support extending the 2017 federal income tax cuts, but not for the wealthy or for corporations.
- Half of Americans say they support extending the 2017 federal income tax cuts for people of all income levels (49%), while 26% oppose this and 25% have no opinion. Republicans (70%) are the most likely to support extending these tax cuts compared to independents (51%) and Democrats (33%).
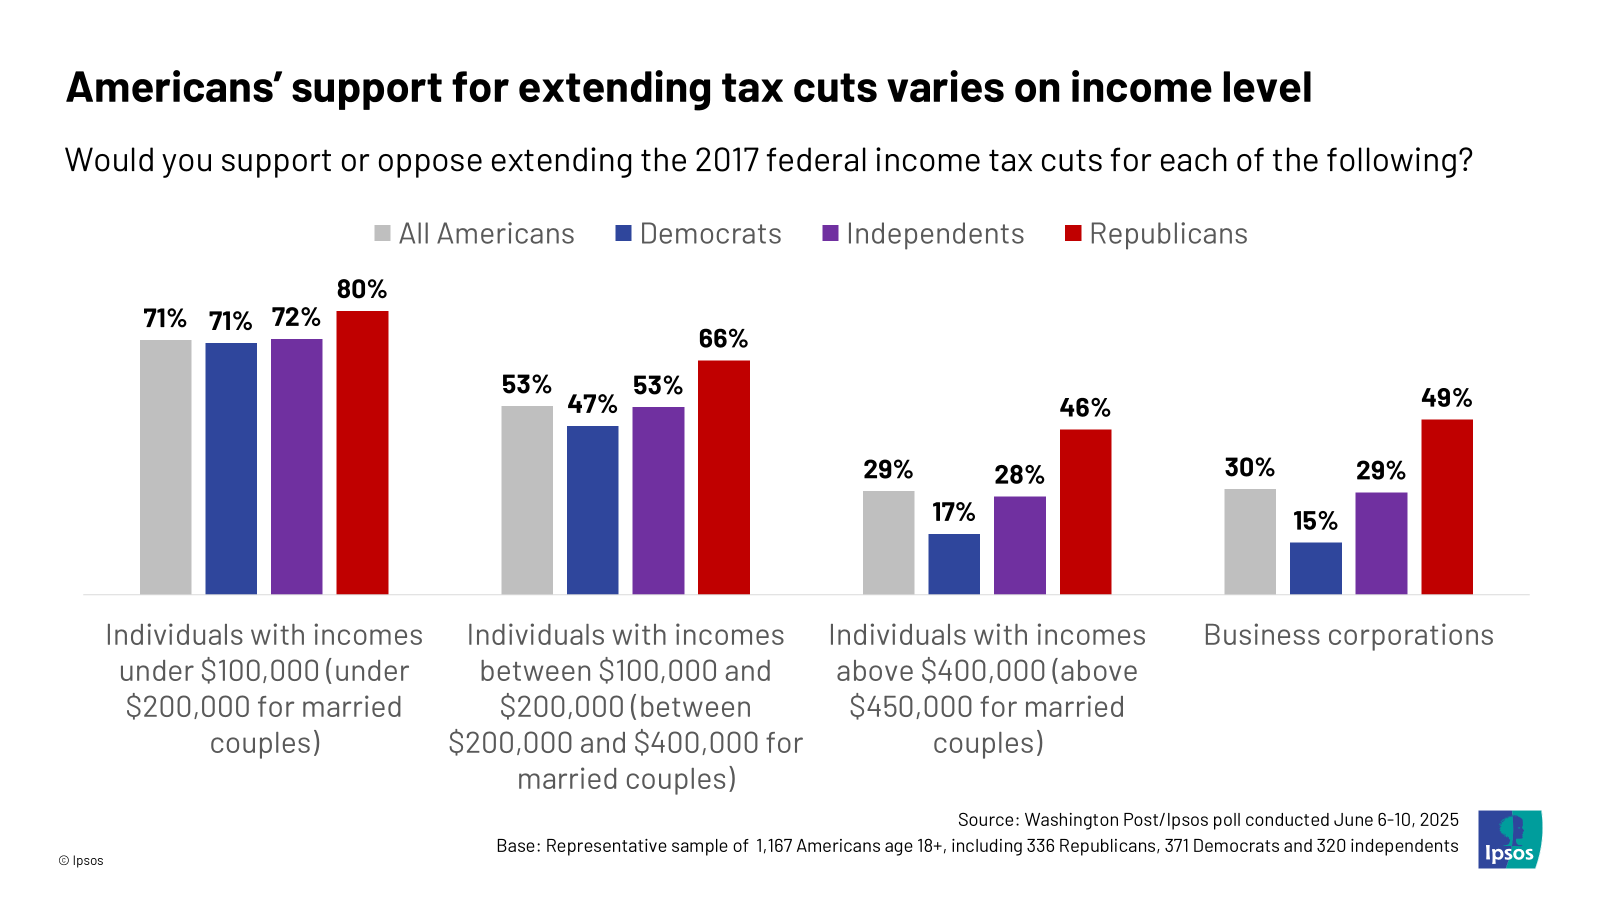
- Americans’ attitudes toward the extension of the 2017 tax cuts depends on who is at the receiving end of these tax cuts. Seven in ten (71%) support extending the 2017 tax cuts for individuals with incomes under $100k and for married couples with incomes under $200k. Half support extending the tax cuts for individuals making $100k-$200k and for couples making $200k-$400k (53%). Three in ten support the same tax cut extensions for individuals with incomes above $400k and couples with incomes above $450k (29%) or for business corporations (30%).
- Differences in attitudes toward tax cuts hold across partisanship. For example, most Democrats support extending the 2017 tax cuts for individuals with incomes under $100k (71%), while 17% support extending these tax cuts for individuals with incomes above $400k. Republicans (80%, 46%) and independents (72%, 28%) also feel similarly.
3. Support for specific provisions of the bill is deeply divided among partisans, except for increasing the child tax credit and eliminating taxes on tips, which receive bipartisan support.
- Americans support increasing the annual child tax credit from $2,000 to $2,500 for parents who are U.S. citizens (72% support) and eliminating taxes on earnings from tips (65%).
- On the other hand, reducing federal funding for food assistance to low-income households (23% support) and spending about $45 billion to build and maintain migrant detention centers (24%) are the least popular provisions of the bill, out of those included in this poll.
- Partisans are deeply divided on key provisions of the bill. Support for spending about $50 billion to complete a wall along the U.S.-Mexico border is particularly divided along partisan lines, receiving overwhelming support from Republicans (72% support) and overwhelming opposition from Democrats (86% oppose). Partisans are also divided on increasing military spending by about $150 billion (62% support among Republicans, 27% support among Democrats) and ending the $7,500 federal tax credit for consumers buying an electric vehicle (61%, 27%).
- On the other hand, increasing the child tax credit has widespread support from both Republicans (79% support) and Democrats (78% support). Eliminating taxes on tips also has positive support from both Republicans (79%) and Democrats (57%) but has more support among Republicans.
4. The potential loss of Medicaid coverage for millions of Americans is generally not considered acceptable but varies depending on how the question is asked.
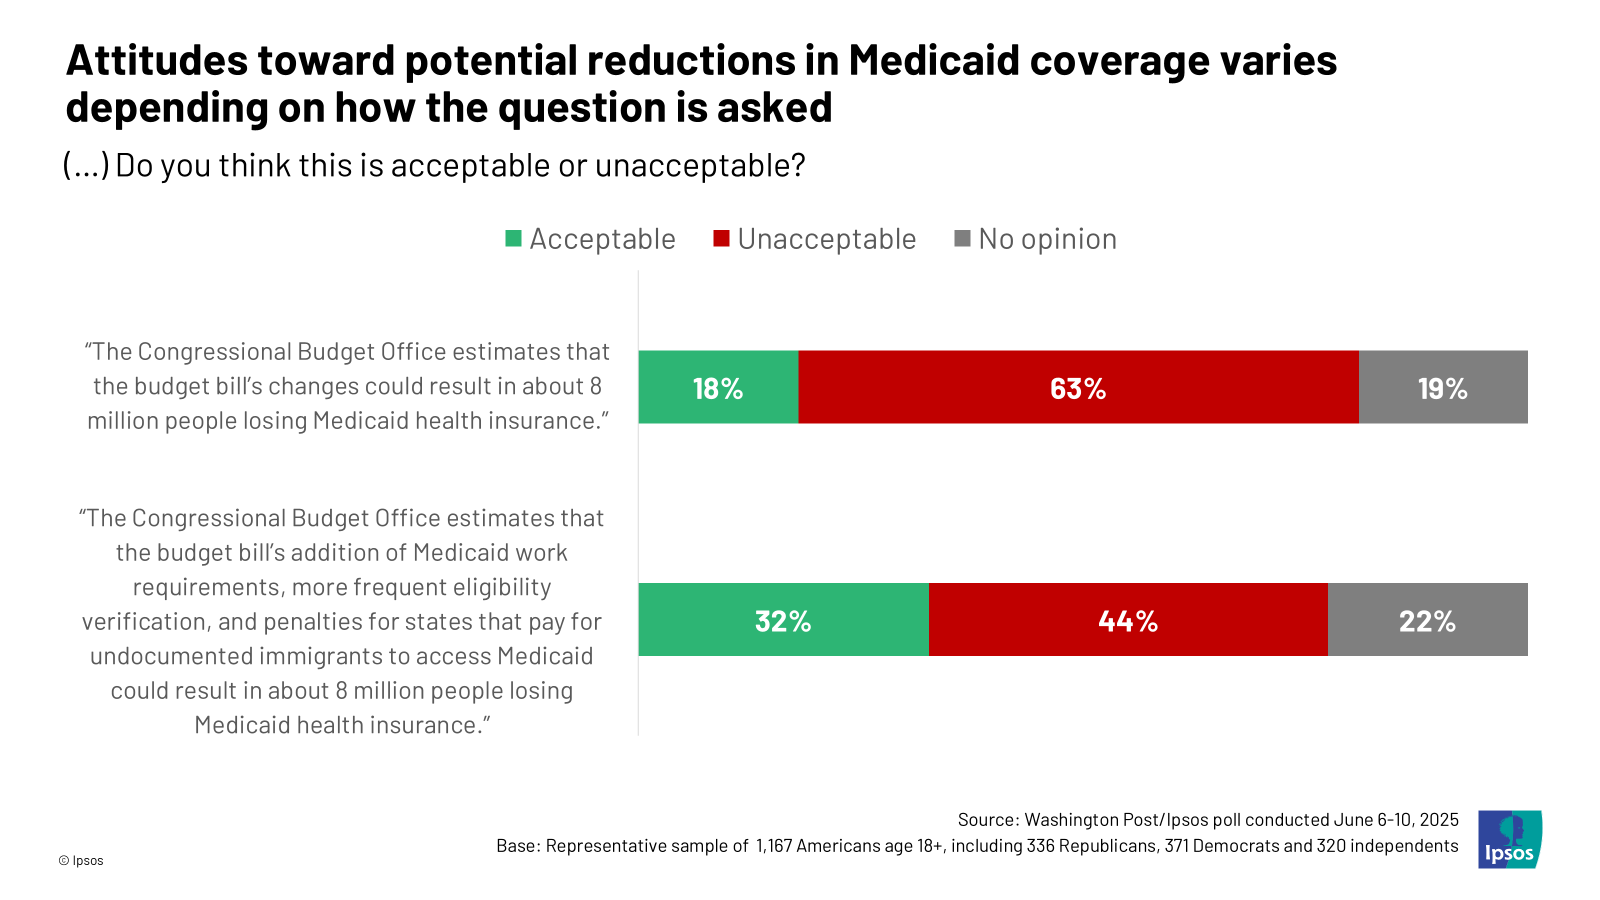
- The poll asked about potential changes to Medicaid coverage in two ways. Two in three (63%) Americans say it is “unacceptable” that estimates suggest the bill’s changes could result in about 8 million people losing Medicaid health insurance. One in five consider it “acceptable” and 19% have no opinion.
- However, more Americans say it is “acceptable” (32%) that the “budget bill’s addition of Medicaid work requirements, more frequent eligibility verification, and penalties for states that pay for undocumented immigrants to access Medicaid could result in about 8 million people losing Medicaid health insurance.” A plurality finds this “unacceptable” (44%) and 22% have no opinion.
About the study
This Washington Post/Ipsos poll was conducted June 6 to June 10, 2025, by Ipsos using the probability-based KnowledgePanel®. Invitations were sent to 1,724 panelists, resulting in 1,167 completed interviews.
In quality control, two respondents were removed for skipping all the questions.
The survey was conducted using KnowledgePanel, the most well-established online probability-based panel that is representative of the adult US population. Our recruitment process employs a scientifically developed addressed-based sampling methodology using the latest Delivery Sequence File of the USPS – a database with full coverage of all delivery points in the US. Households invited to join the panel are randomly selected from all available households in the U.S. Persons in the sampled households are invited to join and participate in the panel. Those selected who do not already have internet access are provided a tablet and internet connection at no cost to the panel member. Those who join the panel and who are selected to participate in a survey are sent a unique password-protected log-in used to complete surveys online. As a result of our recruitment and sampling methodologies, samples from KnowledgePanel cover all households regardless of their phone or internet status and findings can be reported with a margin of sampling error and projected to the general population. KnowledgePanel members receive a per survey incentive, usually the equivalent of $1 (though for some it is $2) in points, that can be redeemed for cash or prizes. Two email reminders were sent to hard-to-reach respondents. Hard-to-reach is defined as 18-29 years old or non-Whites and less than high school. The remainder of the sample received one reminder email.
The study was conducted in English only. The respondents were randomly split into two groups for the purpose of testing different concepts in the survey. Each group was weighted to adjust for gender by age, race/ethnicity, education, Census region, metropolitan status, household income, 2024 presidential vote choice, and party identification. The demographic benchmarks came from 2024 March Supplement of the Current Population Survey (CPS) from the US Census Bureau. The 2024 presidential vote choice benchmarks came from the federal elections 2024 election results for the U.S. President while the Party Identification came from the 2024 National Public Opinion Reference Survey (NPORS). The weighting categories were as follows:
- Gender (Male, Female) by Age (18–29, 30–44, 45–59, and 60+)
- Race/Hispanic Ethnicity (White Non-Hispanic, Black Non-Hispanic, Other or 2+ Races Non-Hispanic, Hispanic)
- Education (No high school diploma or GED, High school graduate (high school diploma or the equivalent GED), Some college or Associate’s degree, Bachelor’s degree, Master’s degree or above)
- Census Region (Northeast, Midwest, South, West)
- Metropolitan status (Metro, non-Metro)
- Household Income (Under $25,000, $25,000-$49,999, $50,000-$74,999, $75,000-$99,999, $100,000-$149,999, $150,000+)
- 2024 Presidential Vote Choice (Harris, Trump, Another candidate, Did not vote/Refused/Not asked)
- Party Identification (Republican, Lean Republican, No lean/Refused, Lean Democrat, Democrat)
The margin of sampling error is plus or minus 3.0 percentage points at the 95% confidence level, for results based on the entire sample of adults. The margin of sampling error takes into account the design effect, which was 1.10. The margin of sampling error is higher and varies for results based on sub-samples. Sampling error is only one potential source of error. There may be other unmeasured non-sampling error in this or any poll. In our reporting of the findings, percentage points are rounded off to the nearest whole number. As a result, percentages in a given table column may total slightly higher or lower than 100%. In questions that permit multiple responses, columns may total substantially more than 100%, depending on the number of different responses offered by each respondent.
About Ipsos
Ipsos is one of the largest market research and polling companies globally, operating in 90 markets and employing nearly 20,000 people.
Our passionately curious research professionals, analysts and scientists have built unique multi-specialist capabilities that provide true understanding and powerful insights into the actions, opinions and motivations of citizens, consumers, patients, customers or employees. Our 75 business solutions are based on primary data from our surveys, social media monitoring, and qualitative or observational techniques.
“Game Changers” – our tagline – summarizes our ambition to help our 5,000 clients navigate with confidence our rapidly changing world.
Founded in France in 1975, Ipsos has been listed on the Euronext Paris since July 1, 1999. The company is part of the SBF 120, Mid-60 indices, and is eligible for the Deferred Settlement Service (SRD).
ISIN code FR0000073298, Reuters ISOS.PA, Bloomberg IPS:FP
35 rue du Val de Marne
75 628 Paris, Cedex 13 France
Tel. +33 1 41 98 90 00