Can We Have Trust And Diversity?
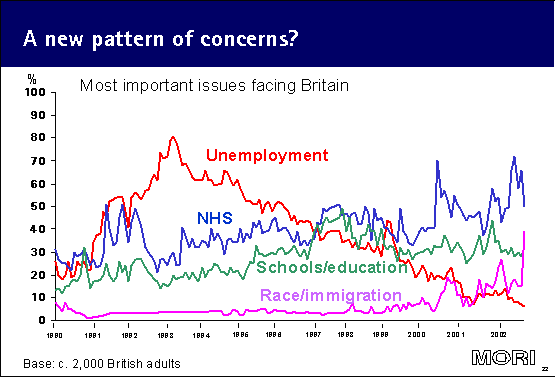
Immigration/asylum is now the third most important issue facing Britain today, ahead of defence, crime/law and order and the economy. Only the NHS and education are seen as more pressing.
This is a remarkable rise in concern over the past few years (see chart below) which cannot be ignored, even if it is an uncomfortable trend. It also cannot be dismissed as the result of media hype -- but equally it is important to realise that people do have an enormously inflated view of the scale of the issue. As a nation we think 23% of the British population are first-generation immigrants, when in fact the figure is 6%.
The increasing diversity of our population has been held up as a possible cause of the decline in levels of trust in each other reported in surveys in recent years. Research from America in particular has shown that those living in highly diverse areas tend to have lower levels of trust.
A new MORI Social Research Institute survey published in the next issue of Prospect magazine (out 22nd January) sheds some light on these issues in Britain. The survey suggests that maybe the more important underlying factors are the increased pressures of work, the rise of individualised entertainment such as TV and the internet, and our general levels of resentment and suspicion that other people are free-riding.
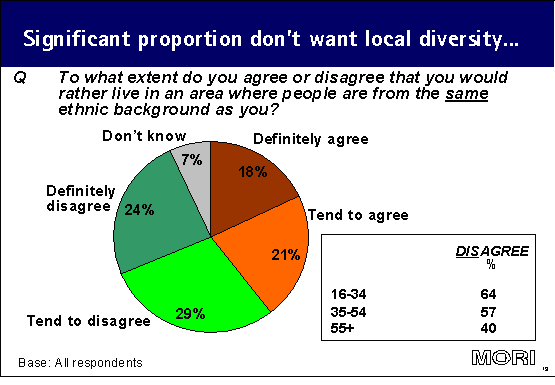
But when we ask people directly about preferences for the ethnicity of people living in their local area, nearly four in ten (39 per cent) say they would rather live in an area where people are from the same ethnic background as themselves.
This is higher than we might have expected, particularly given the sensitivity of the question. But of course, it will often not be directly about ethnicity or race, but will be a shorthand for wanting to live in areas where people share your values -- something that 85 per cent of people say they want. For some people the idea of ethnic diversity will simply conjure up negative images of deprived, inner city areas.
There is also a real age divide in responses to the question, with younger people much more likely to disagree. It seems likely that this represents a real generational difference, and we are therefore likely to see a decline in this attitude over time, although the pattern will also at least partly be because people change their attitudes as they get older.
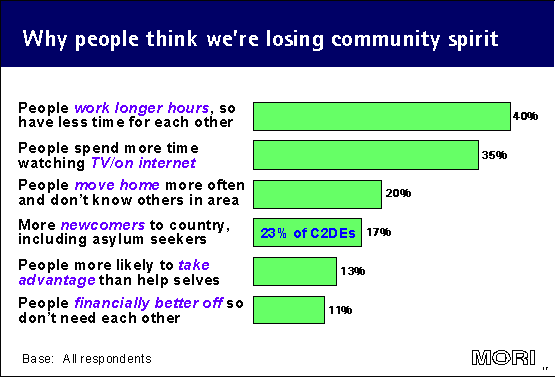
Supporters of diversity can draw some comfort from the survey. In particular, when asked about why there is less community spirit in Britain today (and then asked to choose one or two from six reasons) 40 per cent of people selected people working longer hours, 35 per cent selected people spending more time watching television or on the internet, 20 per cent selected people moving home more often and only in fourth place, with 17 per cent, came "there are more newcomers to the country, including immigrants and asylum seekers."
But in any case, it seems that many people's concern about ethnic diversity is often largely a part of a broader anxiety about other people free-riding. When asked in the MORI/Prospect poll whether other people get unfair priority when it comes to public services and state benefits 45% agreed that they did. This rises to over half among lower social classes, who will have most contact with these services and benefits, and, in a sense, most to lose.
This is a startling level of suspicion but it is not particularly new; in a 1996 survey, people thought 16337 out of every 163100 of welfare benefits was being paid out in fraudulent claims. People are just very sensitive to free-loading, and believe it is widespread.
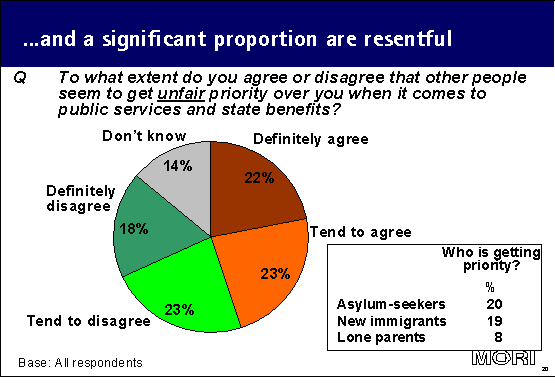
The groups we are most likely to feel resentful of are asylum-seekers and recent immigrants, which are far and away the most mentioned. This is a very different pattern to what we would have seen ten or 15 years ago, when lone parents and the unemployed in general tended to be the groups identified as undeserving. In a sense, this should not really be that surprising, as these groups are most obviously "strangers" to us, and we are less likely to identify with their position or be sure that they will share our values.
We might also take some comfort from the fact that very few people cited established minorities, in particular, Asian people or black people. Indeed, we know from our previous work for the Commission for Racial Equality that 86 per cent disagree that you need to be white to be British -- which suggests that most people's sense of the British "us" does extend to ethnic minorities.
Reflecting the strength of concerns about immigration, there is some appetite among the public for restriction of welfare provision for immigrants. One in five believe that immigrants should just get less welfare support than existing British citizens. The majority (58 per cent) though believe that they should get the same so long as they demonstrate commitment to the country, such as through learning the language or history.
Q Which one of the following three options comes closest to your views?
| 160 | % |
|---|---|
| Immigrants should get the same level of welfare support as existing British citizens | 18 |
| Immigrants should only get the same level of welfare support as British citizens if they demonstrate commitment to the country (e.g. learning the language and history). | 58 |
| Immigrants should get less welfare support than British Citizens | 19 |
| Don't know | 4 |
| Refused | * |
The greatest difference in views between sub-groups of the population is by social class, not ethnicity, with 28% of the lowest social classes saying there should be less support whatever the circumstances, compared with 11% of the highest classes. Again, this is not surprising, as these groups will feel most vulnerable to losing out if finite resources are spread more widely.
These issues are too important to be ignored just because they are uncomfortable or politically sensitive. But we do need to avoid jumping to simplistic conclusions. Clearly none of these findings provide a case for attempting to reverse diversity in local areas, just better management of the process.
One of our best hopes is perhaps to encourage local people to mix in more meaningful ways. Evidence from the US suggests that this will happen most effectively when there is real local control of areas, of priorities, the services that are provided and how they are run. As well as focusing on the continuing role of the nation state in sustaining a common culture, increased localism could be vital in providing a means for greater interaction.
However, this is clearly not an easy solution. The experience of a number of regeneration schemes, and some New Deal for Community partnerships in particular, have highlighted the difficulties and risks involved. This type of local control asks a lot from local people -- mistakes will be made and it is likely that there will be periods of significant conflict. Capture of programmes by local groups or individuals, to the exclusion of others, can also be an issue. But there are plenty of examples that have shown the real benefits that can be achieved, and we need to learn from these.
Topline Results
- Results are based on 1,000 interviews conducted by telephone with a representative sample of British public aged 16 and over.
- Interviews were conducted between 28 November and 1 December 2003.
- Data are weighted by gender, age, work status, tenure and region to the known profile of the population.
- Where results do not sum to 100%, this may be due to multiple responses, computer rounding or the exclusion of 'don't know/not stated' response categories.
- Answers are based on all, unless otherwise stated.
Q1 How satisfied or dissatisfied are you with your local neighbourhood as a place to live? Is that fairly or very?
| 160 | % |
|---|---|
| Very satisfied | 40 |
| Fairly satisfied | 42 |
| Neither satisfied nor dissatisfied | 5 |
| Fairly dissatisfied | 6 |
| Very dissatisfied | 5 |
| Don't know | 1 |
Q2 Some people say there is less community spirit among people in Britain today. Which one or two of the following reasons, if any, do you think are most important in explaining this?
| 160 | % |
|---|---|
| People work longer hours and so have less time for each other | 40 |
| People spend more time watching TV or on the internet and so have less time for each other | 35 |
| People move home more often and don't know other people in their area | 20 |
| There are more newcomers to the country, including immigrants and asylum seekers | 17 |
| People are more likely to take advantage of others, rather than try to help themselves | 13 |
| People are financially better off and don't need each other so much | 11 |
| None/do not think there is less community spirit | 5 |
| Don't know | 3 |
Q3 To what extent do you agree or disagree that other people seem to get unfair priority over you when it comes to public services and state benefits Is that definitely or tend to?
| 160 | % |
|---|---|
| Definitely agree | 22 |
| Tend to agree | 23 |
| Tend to disagree | 23 |
| Definitely disagree | 18 |
| Don't know | 14 |
Q4 Which people, if any, do you think get unfair priority over you when it comes to public services and state benefits?
Base: All who think other people seem to get unfair priority (440)
| 160 | % |
|---|---|
| Asylum seekers/Refugees | 20 |
| New immigrants | 19 |
| Single parents | 8 |
| Unemployed people | 7 |
| Old people | 6 |
| Non workers/people who could work but don't | 5 |
| Young people | 3 |
| Poorer people | 3 |
| Minorities generally | 3 |
| Fraudsters/benefit cheats | 2 |
| People on benefits | 2 |
| Asian people | 2 |
| Disabled people | 2 |
| Richer people | 2 |
| Black people | 2 |
| Newcomers to this area | 1 |
| Illegal immigrants | 1 |
| Criminals | 1 |
| Pakistani people | 1 |
| African people | 1 |
| Indian people | 1 |
| The homeless | * |
| Students | * |
| White people | * |
| Other | 10 |
| Don' t know | 21 |
Q5 Thinking about your neighbourhood now. What proportion of people in your neighbourhood are from the same social class as you? Would you say...
| 160 | % |
|---|---|
| All | 13 |
| Nearly all | 24 |
| Most | 25 |
| Half | 19 |
| Less than half | 8 |
| Hardly any | 4 |
| None | 1 |
| Don't know | 5 |
Q6 And what proportion of people in your neighbourhood are from the same ethnic background as you? Would you say...
| 160 | % |
|---|---|
| All | 26 |
| Nearly all | 33 |
| Most | 20 |
| Half | 7 |
| Less than half | 5 |
| Hardly any | 6 |
| None | 2 |
| Don't know | 2 |
Q7 I am now going to read out couple of statements and I would like you to tell me whether you agree or disagree with each. Is that definitely or tend to...
| 160 | Definitely agree | Tend to agree | Tend to disagree | Definitely disagree | Don't know | Refused |
|---|---|---|---|---|---|---|
| 160 | % | % | % | % | % | % |
| Having a mix of different people in an area makes it a more enjoyable place to live | 27 | 38 | 19 | 8 | 8 | * |
| I would rather live in an area where people are from the same ethnic background as me | 18 | 21 | 29 | 24 | 6 | 1 |
| I would rather live in an area where people share similar values to me | 53 | 32 | 9 | 4 | 2 | 0 |
Q8 Which one of the following three options comes closest to your views:
| 160 | % |
|---|---|
| Immigrants should get the same level of welfare support as existing British citizens | 18 |
| Immigrants should only get the same level of welfare support as British citizens if they demonstrate commitment to the country (e.g. learning the language and history). | 58 |
| Immigrants should get less welfare support than British Citizens | 19 |
| Don't know | 4 |
| Refused | * |


