Beyond the pump: 5 key drivers of convenience store satisfaction
Consumers’ expectations for gas stations go beyond the fueling experience. 55% of gas station consumers visit the on-site convenience store, either while they fill up on gas (32%) or just for the c-store (23%). The increasing popularity of electric vehicles is only expected to increase the percentage of consumers visiting the c-store, given the longer time consumers spent recharging. But Ipsos research suggests that many brands are failing to seize this opportunity.
The latest wave of Ipsos’ Petro-Convenience Experience Study, which measures how leading retail petroleum brands across the US deliver against consumer expectations, found that only 44% of consumers are highly satisfied with their convenience store experience, and only 47% of consumers are satisfied with their fueling experience.
TOP 5 DRIVERS OF OVERALL C-STORE SATISFACTION
- Product Assortment:
Limited gaps in shelf space and customers are able to find their desired items easily - Desired Product Availability:
Having the items customers desire in stock - Employee Interaction:
The customer service representative was friendly and helpful during their transaction - Clean, Stocked & Available Restrooms:
Restrooms are properly maintained and available to customers - Cleanliness of C-Store:
Maintaining the store interior
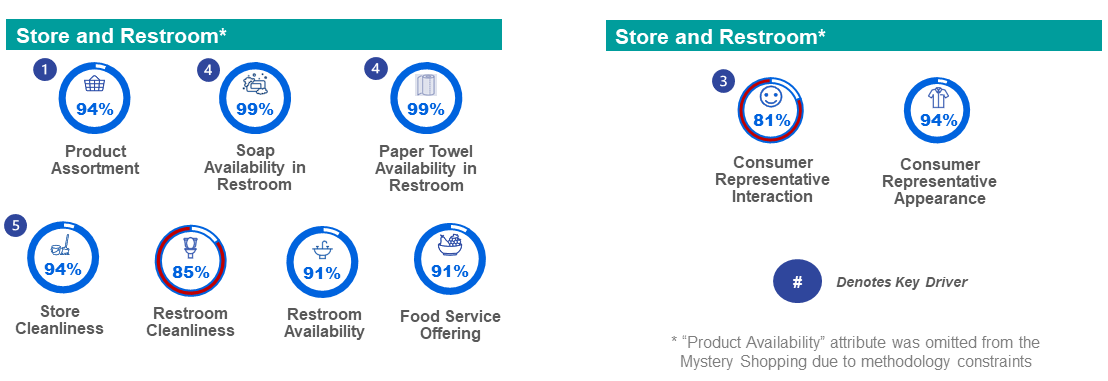
Only about half (7 of the 15) of the retail petroleum brands measured in Ipsos’ study are performing at or above average consumer expectations. Employee interaction was the lowest-scoring c-store attribute across the brands measured in the study, at 81%, based on the mystery shops conducted within this study. Despite most brands having a stocked restroom, only 85% were found suitable for customer use.
The Petro-Convenience Experience Study also reveals that retail petroleum brands have the opportunity to differentiate their c-store customer experience by expanding their product availability (keeping items in stock) and food service offerings (the assortment of items across various dayparts). There is a 26-point difference between top-performing brands and lower-performing brands on product assortment, which was the biggest key driver uncovered in the study. For food service offerings, the difference is 38 points.
The evidence shows that by consistently delivering on the site and experience attributes that consumers care about, petro-convenience retailers can drive increased fuel sales. To learn more about how leading brands are partnering with Ipsos to measure and manage their site experiences, contact [email protected] and [email protected].
METHODOLOGY
Ipsos conducted a three-phased study of the retail fuel and convenience environment between June and September 2023 consisting of a consumer survey (Phase 1), the results of which provided a key drivers analysis (Phase 2) and a mystery shopping program across the United States (Phase 3). As the only integrated competitive study of its kind on the market today, the program identified current expectations of retail fuel and convenience consumers and used these “Voice of the Customer” attributes to design a mystery shop program that measured execution of these experience elements among 15 retail fuel and convenience brands.
For more information on the Ipsos Petro-Convenience Report or request a copy of the results, contact [email protected].