Interactive Map: Protests in wake of George Floyd killing touch all 50 states
A team of researchers from Ipsos, the University of Chicago, and Oxford has collected and analyzed data about the wave of protests that have swept the United States since the killing of George Floyd in Minneapolis. This research indicates that the large majority (about four-fifths) of the over 970 protests identified appear peaceful. Additionally, these protests have occurred in over 400 separate cities and towns across the U.S. touching every state.
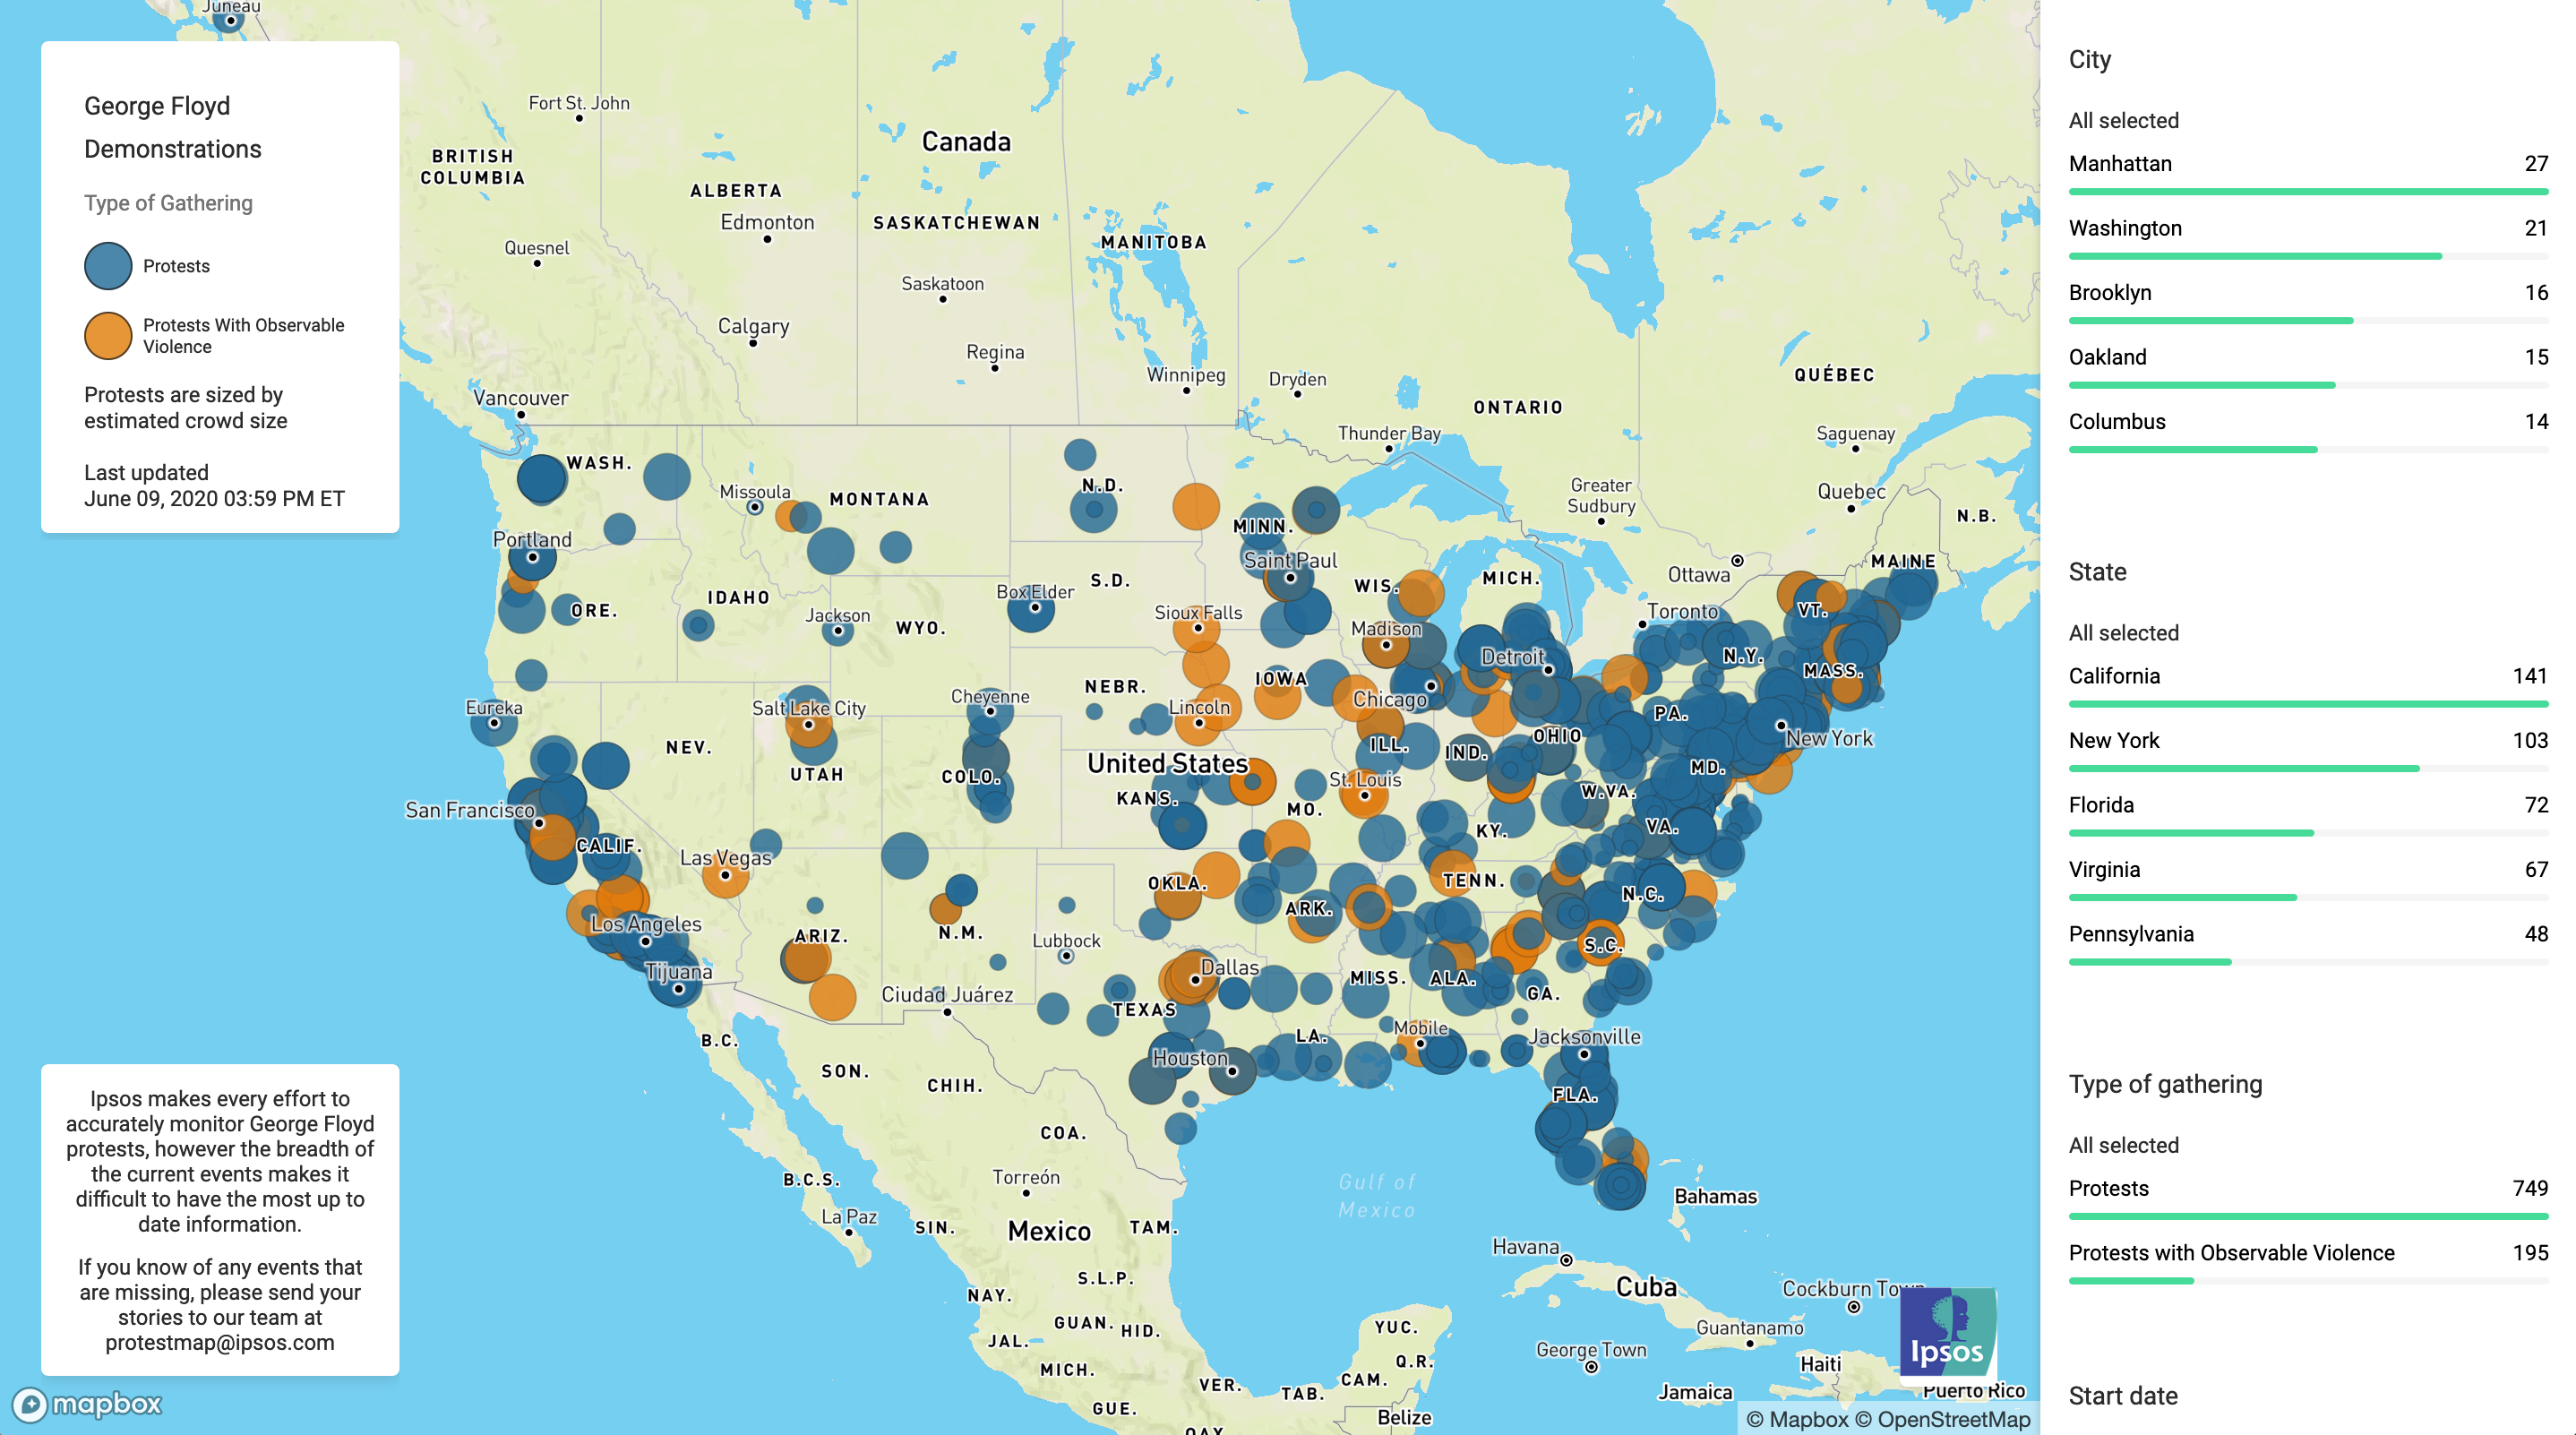
This analysis was conducted by collecting geo-located volunteered social media videos of the protests across the country, cross referencing that information against local news reports, recent satellite imagery, Google Street View and known landmarks to verify locations, as well as anonymized surges in cell phone activity provided by Safegraph. The data currently displayed represents activity identified between May 28th and June 8th.
Ipsos makes every effort to accurately monitor and identify ongoing George Floyd protests, however the breadth of the current events makes it difficult to have the most up to date locations of protests. If you see any events that may be missing, please send your videos, stories, photos of the event as well as the location to our team at [email protected].
![[WEBINAR] 2026 KEYS: The Frontiers of Brand Trust](/sites/default/files/styles/list_item_image/public/ct/event/2026-06/thumbnail-keys-0709_.png?itok=Z3yGpXTY)
![[WEBINAR] Ipsos Global Influentials: In Their Own Words](/sites/default/files/styles/list_item_image/public/ct/event/2026-06/thumbnail-templates_0.png?itok=cHr4zS5w)
![[WEBINAR] Trust, Values & Growth Audiences: Innovation, Inclusion & Insights](/sites/default/files/styles/list_item_image/public/ct/event/2026-06/thumbnail-templates.png?itok=XcWEzpQn)