Towards more agile and efficient product testing
 The historic assumption that larger sample sizes are needed for product tests derives from the hypothesis that there is a risk of unreliable and varying consumer responses, i.e., variance. Today, large consumer panels and databasing of consumer responses allow us to revisit historic variance assumptions for product development.
In this paper we investigate the variance of products tested across regions and categories using different scales from 36,500 consumers in our database. We assess how reliable a smaller sample size of n=50 is versus larger samples of n=150 or more when testing products in the early stage and later stage of the product development life cycle.
Our findings suggest small sample sizes can be considered when the objective is to create differentiating products such as for pre-screening of prototypes. Such pre-screening allows us to save cost and time by reducing the number of products required for further testing. However, for other types of testing such as cost rationalization studies, or when subgroups need to be analyzed, larger sample sizes are recommended.
ABSTRACT
The historic assumption that larger sample sizes are needed for product tests derives from the hypothesis that there is a risk of unreliable and varying consumer responses, i.e., variance. Today, large consumer panels and databasing of consumer responses allow us to revisit historic variance assumptions for product development. In this paper we investigate the variance of products tested across regions and categories using different scales from 36,500 consumers in our database. We assess how reliable a smaller sample size of n=50 is versus larger samples of n=150 or more when testing prototypes in the early stage of the product development and (for cost rationalization studies) in the later stage of product development. Our findings suggest small sample sizes can be considered when the objective is to create differentiating products such as for pre-screening of prototypes. Such pre-screening allows us to save cost and time by reducing the number of products required for further testing. However, for other types of testing such as cost rationalization studies, or when subgroups need to be analyzed, larger sample sizes are recommended.
SAMPLE SIZE CONSIDERATIONS
Product testing measures properties or performance of products. It covers any process in which a researcher measures a product’s compliance, performance, safety, and quality. To assess the product properties or performance, product testing survey data can be collected in many ways from face-to-face, telephone, video-based interviewing over to online and mixed mode designs. The type of data collection needs to be chosen in such a way that a sufficient sample size can be collected from the relevant target population (Wilkinson and McTiernan, 2020). The relevant target group sizes in the total population are often, depending on the category and market, in millions. Therefore, a good planning of the right sample size considering the data collection is crucial for the quality of any intended research (Maxwell et al, 2008). The sample size also has implications for the investment needed to run the research. Prototypes or in-market products need to be provided, shipped, or placed and the empty packaging shipped back or destroyed. Large sample sizes drive these logistical investments and, in many cases, also the research timing. To reduce the need for larger sample sizes and thus more test products, it is important that the sample structure and quality are paid attention to in the planning (Ramsey and Wagner, 2015).
LARGE SAMPLE SIZES ARE NOT NEEDED IN EVERY AREA
Depending on the scope and subject of research, the level of variance between a sample and the total population can be different. For instance, if we were to assess how an indigenous population raise their children, variance could be high. But if we were to examine how the indigenous language in its grammar is constructed, the variance would be lower, and a small sample size could be considered. In the medical industry smaller sample sizes are commonly selected, such as n=15. If the measurements in these tests do not vary much between people, it is possible to handle n=15 with statistical procedures (significance test, estimating types of error). Similarly, in the product development cycle, products need to run through clinical trials too before being tested by consumers. In these clinical studies smaller sample sizes are also often chosen. But even after clinical approval, we find product tests with smaller sample sizes with sensory expert panels ranging from n=10-50 (Lawless and Heymann, 2010) as well as within the factory where batch variability is assessed. Testing the batch variability is basically one of the starting points in history for significance testing in product testing. William Sealy Gosset, who was a master brewer at Guinness, assessed differences between batches of beer, i.e. batch variability, by comparing arithmetic means with each other, later using his pen name “student” t-distribution and test of statistical means (Gosset and Fisher, 1925). His sample sizes were below 50. As products may differ even when factory settings have been maintained, it is important to select products from different production batches. But typically, in product research, there is more variance coming from consumer perceptions than from the variance within the same products from a factory, i.e. batch variability. The sources of such variance can be manifold: if the sampling frame is incorrectly defined, question items unclear or questionnaires too long, response behavior can deviate strongly. Such variance can lead to the situation where it can be observed that two identical products are statistically significantly different in performance. At Ipsos, we put an extra effort into applying strict survey research rules to avoid such situations by reducing the margins of error (qualification of respondents, short enough questionnaire, avoiding response directed questions, clear description of question items, unbiased interview dynamics etc.). As we put all these quality measures in place in our sampling, the hypothesis is derived that data quality should provide the same robustness, independent of its sample size.
WITH GOOD DATA QUALITY, DO SAMPLES WITH N=50 PROVIDE NEARLY IDENTICAL RESULTS AS SAMPLES WITH N=150+?
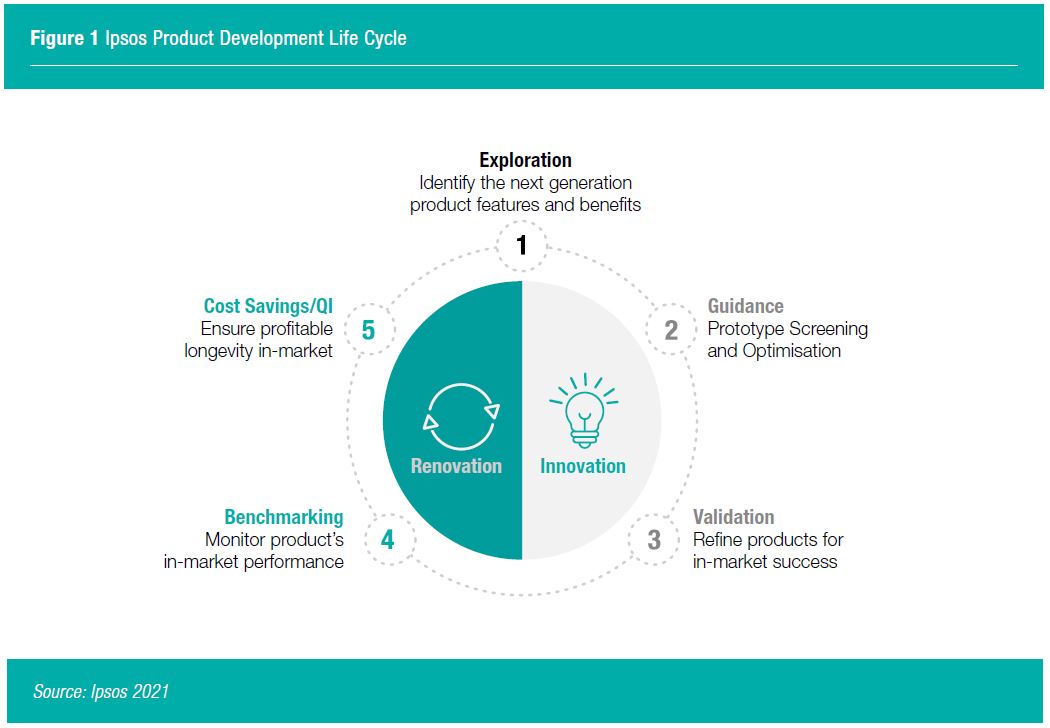
As the world’s largest product tester, Ipsos has the advantage to build upon massive data sets from consumer-based product testing. To answer the key question of whether we would come to the same conclusion with a smaller sample size than with a larger, we randomly selected a subset of studies from the Ipsos Product Database. To answer the second question, at what stage of product development smaller sample sizes can be considered, we selected studies related to guidance testing related prototype screening and cost saving measures (see Figure 1). In total, the analyses encompassed 36,779 consumer responses to how much they liked the product tested rated either a 9-point, 7-point or 5-point Overall Liking scale across Africa, Asia, Europe, Latin America, North America for 185 consumer goods products. To consider category effects, we covered beverages, food, non-human food, personal and home care studies. These studies were conducted between 2015 to 2021. For each study we considered first the full sample (depending on the study: n=150-450) and estimated the gap between the best and worst performing products in overall liking, i.e., “best-worst gap”. Using a Monte Carlo Simulation with 10,000 iterations, we estimated the best-worst gaps of smaller sample size of n=50 per study. To allow a relative comparison between different Overall Liking scales, we divided the best-worst gap by the number of scale points. We then calculated a Pearson correlation coefficient between average consumer acceptance scores of all tested products of a small sample size (n=50) and the average consumer acceptance scores from the original sample size of each study. We ran the analyses separately for early-stage prototype tests and for cost rationalization studies.
SMALL SAMPLE SIZES FOR EARLY-STAGE PROTOTYPE SCREENING
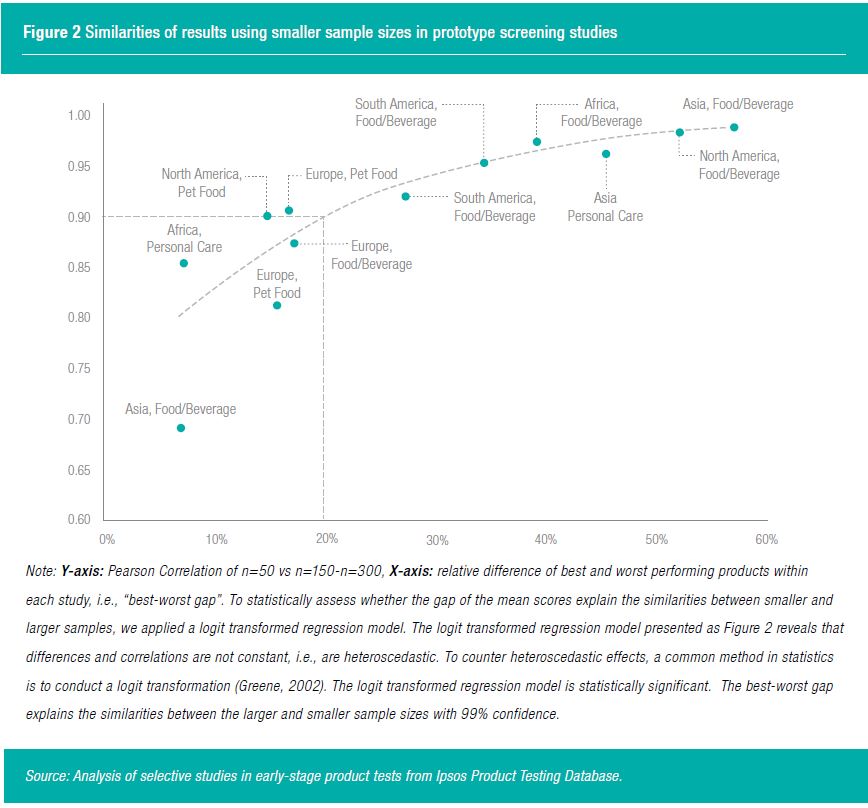
Figure 2 depicts the relationship between the correlations and the relative best-worst gaps of each study. From these relationships we can derive a very strong correlation of +0.9 if the relative best-worst gap is 20% of the scale range or more. Regarding category or regional effects, no specific patterns can be identified. Studies in which the performance differences between the prototypes were 20% or larger, measured by consumer acceptance, were stable with a small sample size of n=50. This means that for early-stage product tests, we should consider prototypes which are differentiating. Sensory panels can make sure differentiated products are selected for consumer-based screening.
SMALL SAMPLE SIZES FOR LATE-STAGE COST SAVING STUDIES
Cost saving studies have an opposite objective to early-stage prototype development. While in prototype development it is more about maximizing differentiation to achieve superiority, in a cost rationalization study it is about minimizing differentiation, i.e., creating nearly identical products. In such studies it is often about ensuring product performance is maintained when removing/modifying ingredients to make a more profitable, for example because there are regulatory changes, or changes in availability of specific ingredients.
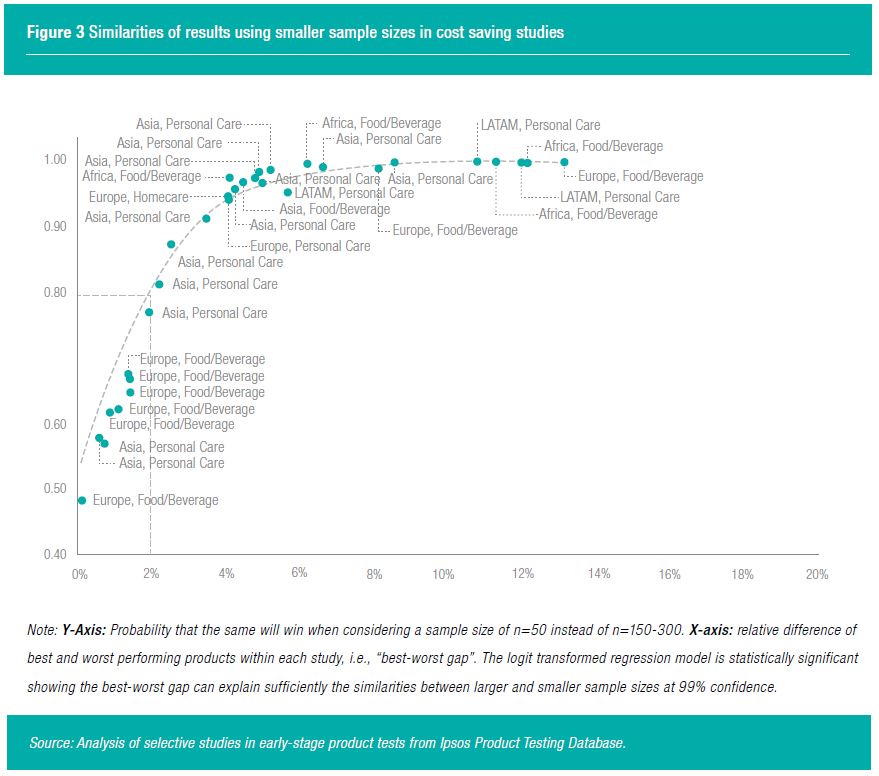
The objective is to avoid alienating consumers without a negative impact in consumer acceptance. Therefore, the goal is to create similar products. Naturally, the best-worst gap is significantly smaller in comparison to an early-stage prototype test (Figure 3). All randomly selected products had a best-worst gap difference lower than 14%. Again, regarding category or regional effects, no specific patterns can be identified. Our product testing experience shows that achievable differences in cost rationalization studies should be less than 2%. However, the correlation declines significantly when we achieve smaller best-worst gaps of 2%. Besides the small correlations with best-worst gaps smaller than 2%, small sample sizes of n=50 pose other challenges in cost rationalization studies. First, a multivariate franchise risk analysis requires a subgroup analyses to estimate alienation reducing the sample size even more. Second, the lower the best-worst gap, the more sensitive the statistical testing needs to be. Having small sample sizes reduces the statistical power. For cost rationalization studies we would not recommend smaller sample sizes to avoid any franchise risk. Especially when examining a subset of consumers, such as heavy users of a product that should not be alienated.
DO WE NEED STATISTICAL TESTING AT ALL?
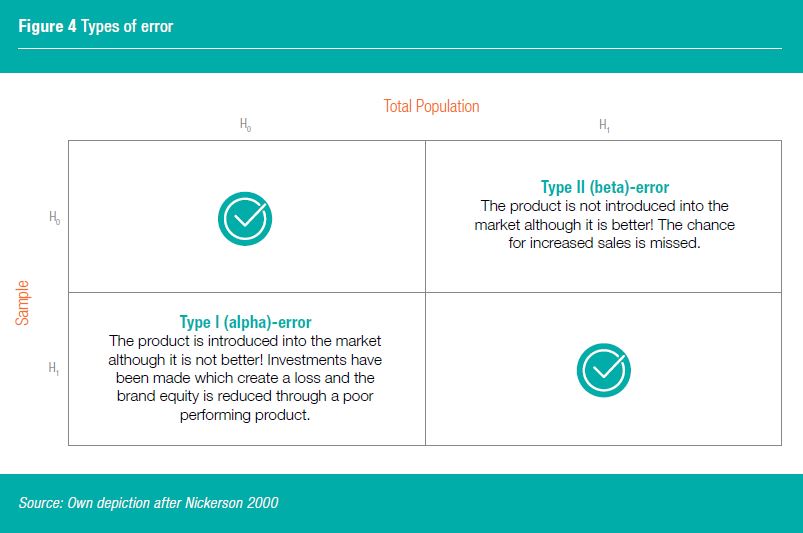
Whether statistical testing is needed or not has been widely discussed in the past and present in academic research (Edwards et al, 1963, Maxwell et al, 2008). In product testing it is crucial for setting “Action Standards”. Depending on the research objective, the “Action Standards” are chosen in such way that a product is either at parity with another product (no difference, i.e. Null Hypothesis), or superior (Alternate Hypothesis). For instance, the “Action Standard” is set to parity for cost reduction projects, whereas for quality improvement projects it is set to superiority. The confidence interval is carefully selected depending on the sample size. For testing purposes, a higher sample size is chosen to boost the “Power” (Sedlmeier and Gigerenzer, 1989). The “Power” in a statistical test is the probability that the test will reject a false null hypothesis, i.e. not making a Type II error (Cohen, 1962). As “Power” increases, the chance of a Type II error decreases and Type I increases as Type I and Type II errors are interconnected. The “Power” is equal to 1 – Type II error. So, if the odds for making a Type II error would be 20%, the power would be 1-20%=80%. However, the reduction of net sample size has a little impact on the quality of the results. The statistical accuracy only decreases in the sense of Type II error. Type I error needs to be accounted for, too. Depending on the business objective of a product test, Type I or Type II error may be more important (Figure 4). Therefore, in product development, statistical testing needs to be carefully considered depending on the business objective. In addition, it should never overrule business related questions on what a truly meaningful difference is. Even if one product underperforms in Sweetness, this does not have to mean that the product will underperform in-market.
MARGIN OF ERROR AND SAMPLE SIZES
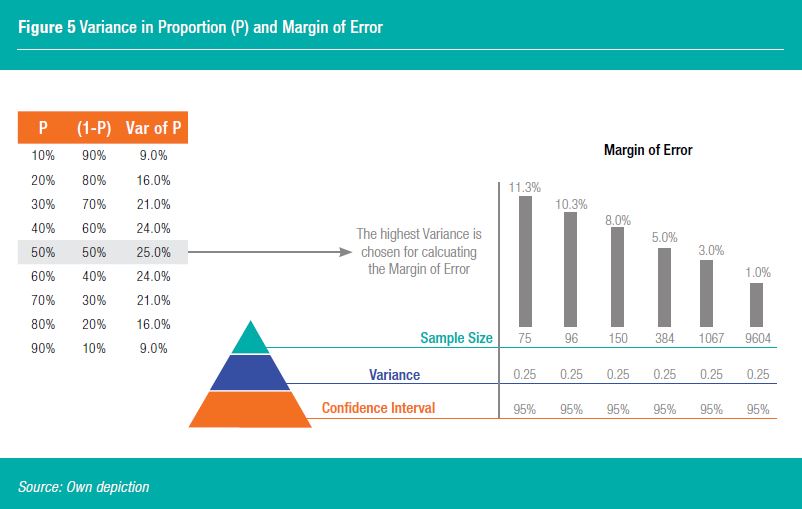
The identification of the required sample size builds upon calculating an acceptable margin of error. The idea behind margins of error is that any survey will differ from the true population by a certain amount. A margin of error informs how many percentage points a sample will differ from the total consumer population value. For instance, a 90% confidence interval with a 3 percent margin of error means that the sample will be within 3 percentage points of the real population value 90% of the time. In textbooks, a maximum variance is considered (Figure 5 and Krejcie and Morgan, 1970) when a proportion (p) is unknown. A proportion (P) is for instance a specific target group for a product among the total population. The variance is put into an equation to calculate a margin of error. In product testing often a margin error of 10% or below is acceptable. A sample size of n=96 would yield 10% margin of error at 95% confidence if the maximum variance is chosen.
But is considering the maximum variance the right way to go in today’s world for all product tests? Online panels and databases provide today the ability to predict proportions more precisely. In addition, the main source for variance is the different sensorial experiences consumers have from the product they tested. There is typically more variance coming from consumer perceptions than from the variance within the same products from a factory. Batch variability can be counted for by making sure products are from different batches or the error or noise within the consumer survey result is larger than mere statistical sampling error. When the same product is tested twice in different samples, it is not rare to observe that two identical products are statistically significantly different. At Ipsos, we put an extra effort applying strict survey research rules to reduce the margin of error (qualification of respondents, short enough questionnaire, avoiding response directed question, clear description of question item, unbiased interview dynamics etc.). If all quality measures are put in place in sampling, data quality should provide the same robustness independent of its sample size.
IN CONCLUSION
Our research has shown that small sample sizes can be considered but we caution that it will not make sense for every product test. It also revealed that smaller sample sizes can be considered for screening of products that are expected to be different, such as in prototype development or when new products are created with the objective to be unique. In such screenings, one would come to the same conclusion based on Overall Liking with n=50 instead of having to produce many more prototypes or purchase different products for larger sample sizes thus saving significant costs and speeding up time. Sensory panels can help to select differentiating prototypes to be screened by consumers. Larger sample sizes should be chosen if sub-group analyses are needed or where there is a critical franchise risk, e.g., in cost saving studies. For cost reductions, the most severe risk is the launch of an inferior product. Furthermore, the results hold across categories and regions. No matter what type of testing or sample size, it is crucial to consider a sample structure and quality that represent the target group sufficiently.

![[WEBINAR] Cracking the Nutritional Supplement Market](/sites/default/files/styles/list_item_image/public/ct/event/2026-05/thumbnail-cracking-nutritional-supplement.png?itok=Cts0kD4T)
![[WEBINAR] Dealmaking 2026: What’s Changing, What’s Not, and How to Position for the Next Wave](/sites/default/files/styles/list_item_image/public/ct/event/2026-03/deal.png?itok=NtU1lGCc)