4 in 10 Britons prefer Bonfire night to Halloween
Ipsos polled the British public on Halloween traditions, and whether they prefer Halloween or Bonfire night. The survey, conducted online among 1,093 British adults aged 18-75 between October 11-14, 2024, reveals a divided nation when it comes to Halloween versus Bonfire Night, and offers a glimpse into what ghoulish creatures commonly associated with Halloween that the public believes best represent the UK’s political parties.
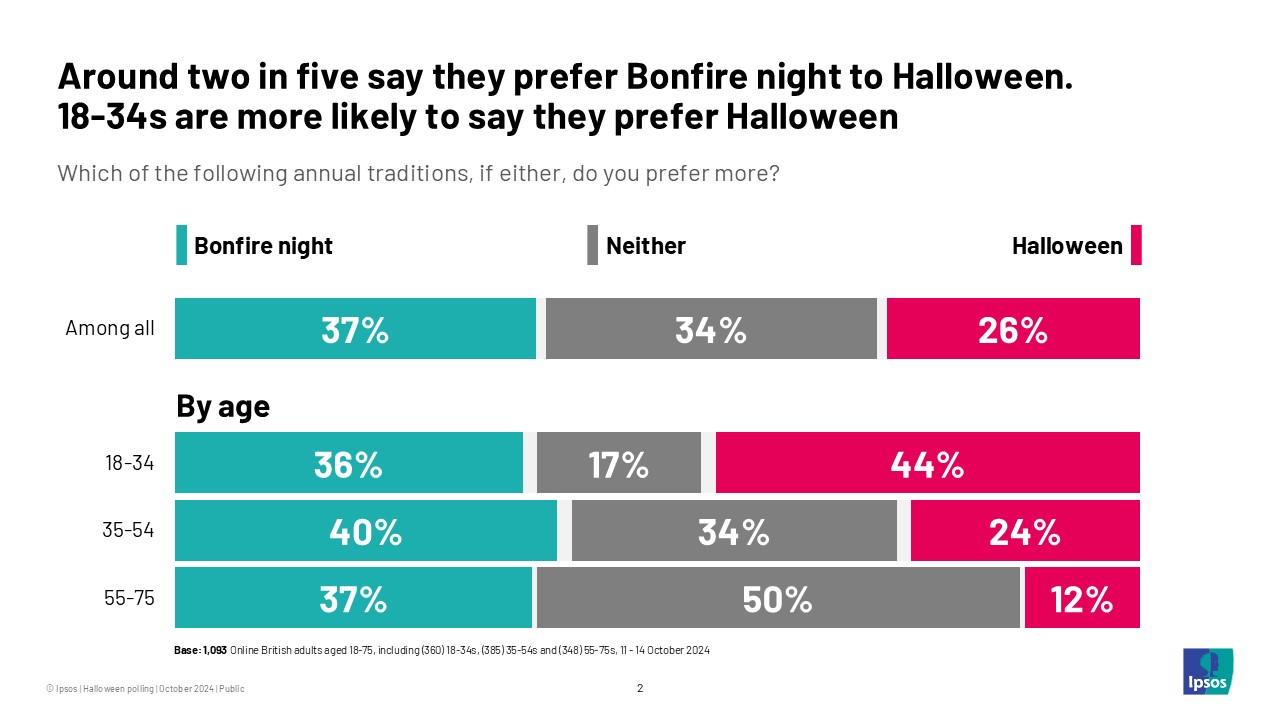
Bonfire Night vs. Halloween: The poll reveals a close contest between Bonfire Night and Halloween, with around two in five respondents (37%) stating a preference for Bonfire Night, compared to 26% who prefer Halloween. Younger adults aged 18-34 are more likely to favour Halloween (44%), suggesting a generational divide in traditional autumnal celebrations.

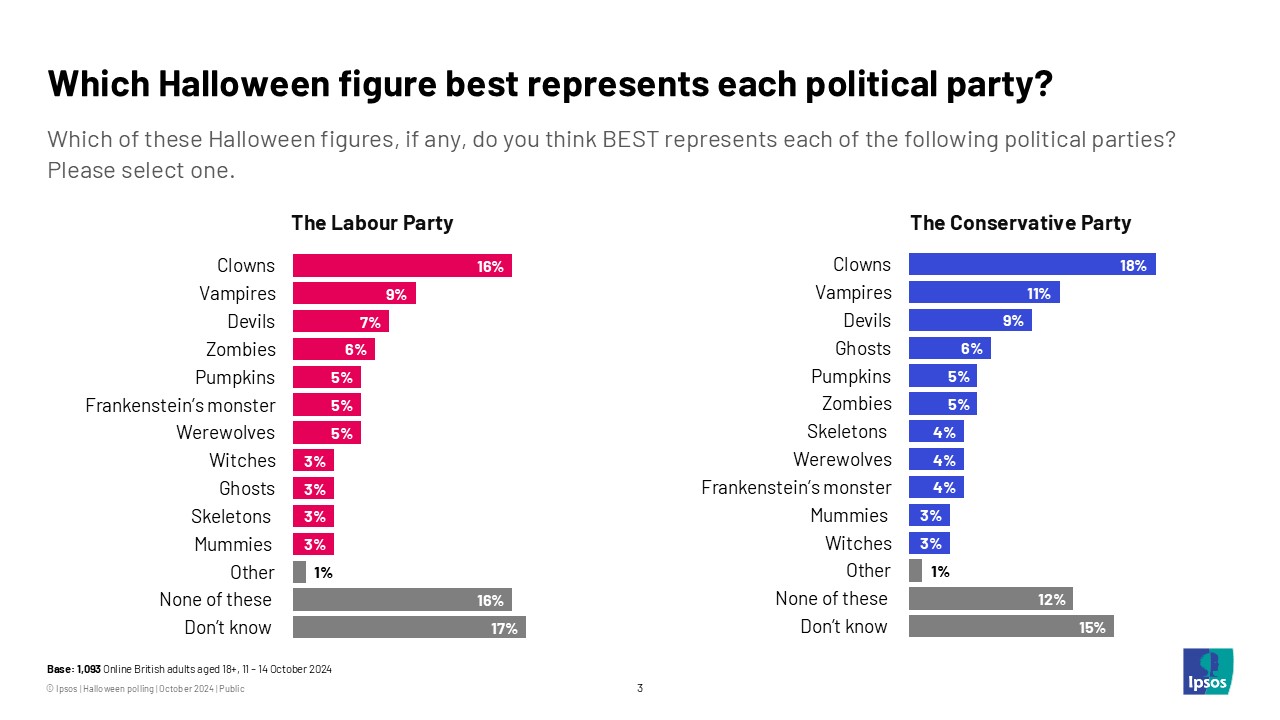
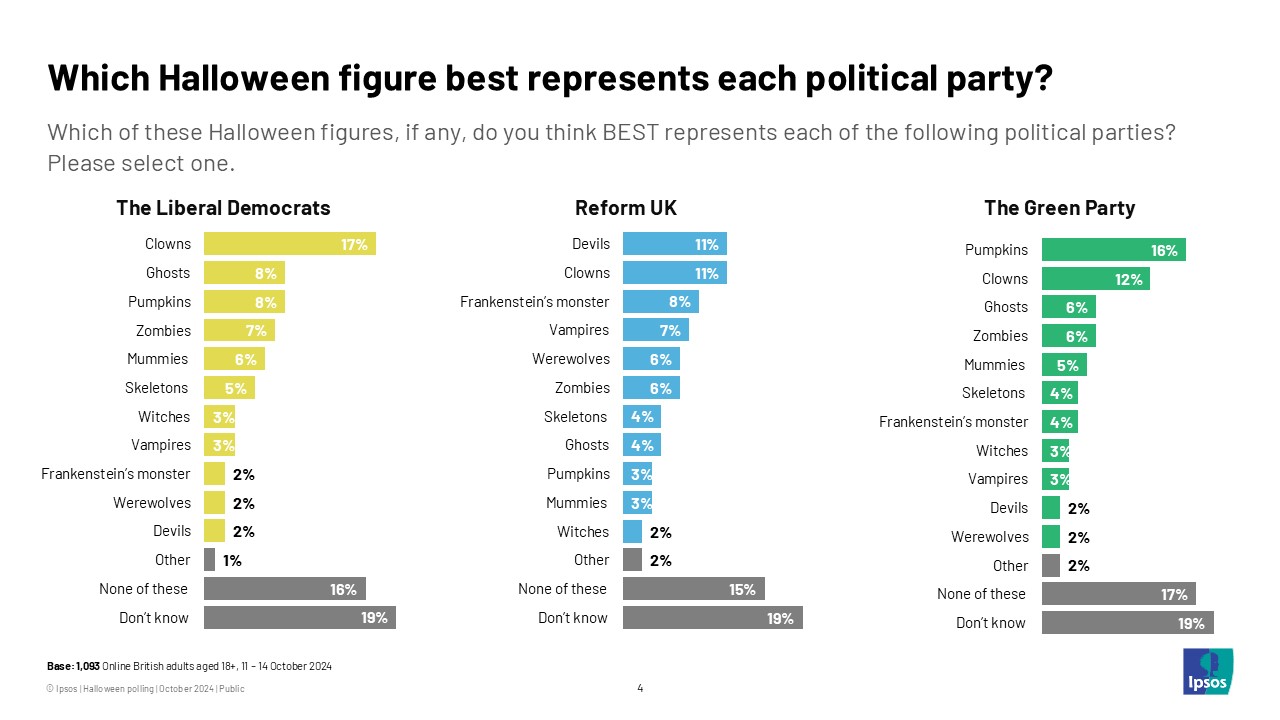
Political Party monsters: When asked which Halloween creatures best represent each political party, clowns were the most popular choice overall.
- Labour Party: Clowns emerged as the most popular association for the governing Labour party (16%), with vampires coming in second (9%).
- Conservative Party: Clowns also topped the list for the Conservatives (18%), followed by vampires (11%).
- Liberal Democrats: Once again clowns were the most common association (17%), followed by ghosts (8%).
- Green Party: Pumpkins were the most associated with the Green Party (16%), with clowns (12%) relegated to second place.
- Reform UK: Devils and clowns were the most frequently chosen figures (11% each).


British attitudes towards fireworks: In a separate poll, people were asked about their attitudes towards fireworks.
- Seven in ten (70%) Britons believe that the sale of fireworks should be limited to specialist fireworks shops (12% oppose).
- Two thirds (66%) support banning the sale of fireworks above a certain noise level (15% oppose).
- Just over half (55%) support banning the sale of fireworks to the public for use in private displays (22% oppose).
- 22% support the banning of organised public firework displays (53% oppose).
- 68% of Britons believe it is acceptable to use fireworks for private displays on Bonfire night (15% oppose). This is similar to the proportion who say it is acceptable on New Year’s Eve (65%). However, less than half support the use of fireworks for private displays to celebrate religious festivals such as Diwali or Eid (48%), celebrations such as weddings or birthdays (43%), and other private gatherings (32%).
Technical note:
- For the questions about preference for Halloween vs. Bonfire night and political party monsters, Ipsos interviewed a representative sample of 1,093 Online British adults aged 18+ between October 11th and 14th 2024.
- For the questions about fireworks, Ipsos interviewed a representative sample of 1,084 Online British adults aged 18-75 between October 25th-28th 2024.
- Data are weighted to match the profile of the population. All polls are subject to a wide range of potential sources of error.


