Republican debate watchers see Haley as the best performer, Ramaswamy as the worst
Washington, DC, November 9, 2023 – A new 538/Washington Post/Ipsos poll conducted immediately following the third Republican primary debate finds that Republican primary voters who watched the debate feel that Nikki Haley performed best, while Vivek Ramaswamy is seen as the worst performer. Still, nearly three in four likely Republican primary voters report not watching any of the debate. Though, more likely Republican primary voters tuned into the debate over former President Donald Trump’s rally in Florida. Also, while Ron DeSantis and Haley have separated themselves from the rest of the candidates, they continue to significantly trail Donald Trump.
To read 538's story, click here. For the Washington Post's story, click here.
Here is the 538/Washington Post pre- and post-debate GOP polling from September.
Here is the 538/Washington Post/Ipsos pre- and post-debate GOP polling from August.

Detailed Findings:
1. Just 27% of Republican primary voters say they watched Wednesday’s debate.
- One in ten report that they watched all of the debate, while 17% percent say they watched some of it.
- Among the 73% of GOP primary voters who did not watch the debate, only 6% report watching Donald Trump’s rally in Florida.
2. For the third debate, Nikki Haley was seen as the best performer, while Vivek Ramaswamy was seen as the worst.
- One in three likely Republican primary voters who watched the debate believe Haley performed the best (34%). This marks a significant improvement for Haley, as just 18% of debate watchers after the second debate said she performed the best.
- Following Haley is DeSantis, with 23% saying he performed the best. No other candidate received more than 14% on this question.
- When asked who performed the worst, Vivek Ramaswamy (29%) was the most selected candidate, followed by Chris Christie (24%). For Ramaswamy, this is a stark contrast from the first debate, in which he was seen as the best performer alongside DeSantis.
3. DeSantis and Haley separated themselves from the rest of the candidates in terms of their debate performance.
- Fifty-five percent of likely Republican primary voters who watched the debate rate Haley’s performance as either excellent or very good, followed by DeSantis (53%). This again represents a significant jump for Haley, as 44% rated her performance in the second debate as excellent or very good.
- Just one in three (33%) debate watchers rate Ramaswamy’s performance as excellent or very good, a significant drop from both the first (55%) and second debate (40%).
- Rounding out the second tier of candidate performance are Tim Scott (28%) and Chris Christie (26%).
4. Despite their debate performances, Haley and DeSantis remain a distant second to Trump regarding who likely Republican primary voters are considering casting their ballot for in the primary.
- Sixty-two percent of likely Republican primary voters have a favorable view of Trump. DeSantis (55%) and Haley (47%) are in the next tier of favorability.
- Third tier candidates include Scott (38%), Ramaswamy (32%), Robert F Kennedy Jr. (28%), and Christie (23%). Just one in ten Republican primary voters rate Doug Burgum or Asa Hutchinson favorably.
- Sixty-three percent of Republican primary voters say they are considering voting for Trump. He is followed by DeSantis (48%) and Haley (38%). No other candidate has more than 20% of likely primary voters considering voting for them.
- Of note, independent voters likely to vote in the Republican primary are considering Trump (49%) and Haley (45%) in roughly equal measure.

5. While the debate moderators received solid overall reviews from debate watchers, some felt they could have covered a couple of the key topics better.
- Forty percent of debate watchers say the moderators had an excellent or very good performance, 41% say it was average, and just 15% feel the moderates did a poor or terrible job. In the second debate, just 31% of debate watchers said the moderators did an excellent or very good job, and 26% said they did a poor or terrible job.
- Debate watchers ages 65 and older (50%) are more likely to say the moderators did an excellent or very good job than those ages 50-64 (35%) and 35-49 (29%).
- Despite a solid overall rating, most feel the moderators did an average job or worse covering key topics, with the net rating varying by topic:
- Dealing with immigration: 40% selected average; +17% net rating (Percent Excellent/Very good - Percent Poor/Terrible)
- How to build the American economy: 45% selected average; +16% net rating
- Reducing crime and promoting public safety: 46% selected average; -6% net rating
- Wokeness or political correctness: 39% selected average; -12% net rating
- Donald Trump’s indictments: 33% selected average; -21% net rating
About the Study
This 538/Washington Post/Ipsos post-debate poll was conducted November 8-9, 2023, by Ipsos using the probability-based KnowledgePanel®. The pre-debate wave of this poll was based on a nationally-representative probability sample of adults age 18 or older fielded October 30 to November 7, 2023, screened to those that indicated they are likely to vote in the upcoming Republican primary or caucus (N=5,339). This post-debate wave, which this topline reports, was administered to the same sample of respondents who took part in the pre-debate wave. Of those, 2,682 responded to the post-wave survey and 731 reported watching all or part of the debate.
The margin of sampling error among all those that responded to the post debate poll is 2.1 percentage points at the 95% confidence level. The margin of sampling error among those who watched all or part of the debate is plus or minus 4.1 percentage points. The margin of sampling error takes into account the design effect, which was 1.28 for all respondents and 1.27 for debate watchers. The margin of sampling error is higher and varies for results based on sub-samples. Sampling error is only one potential source of error. There may be other unmeasured non-sampling error in this or any poll. In our reporting of the findings, percentage points are rounded off to the nearest whole number. As a result, percentages in a given table column may total slightly higher or lower than 100%. In questions that permit multiple responses, columns may total substantially more than 100%, depending on the number of different responses offered by each respondent. The post-debate survey weight factors are the same as those from the pre-debate. As such, the weighted total for post-debate respondents and debate watchers do not match their respective sample sizes.
The weights for the post-debate respondents were not adjusted to account for the nonresponding pre-debate sample.
The survey was conducted using KnowledgePanel, the largest and most well-established online probability-based panel that is representative of the adult U.S. population. Our recruitment process employs a scientifically developed addressed-based sampling methodology using the latest Delivery Sequence File of the USPS – a database with full coverage of all delivery points in the U.S. Households invited to join the panel are randomly selected from all available households in the U.S. Persons in the sampled households are invited to join and participate in the panel. Those selected who do not already have internet access are provided a tablet and internet connection at no cost to the panel member. Those who join the panel and who are selected to participate in a survey are sent a unique password-protected log-in used to complete surveys online. As a result of our recruitment and sampling methodologies, samples from KnowledgePanel cover all households regardless of their phone or internet status and findings can be reported with a margin of sampling error and projected to the general population. KnowledgePanel members receive a per survey incentive, usually the equivalent of $1 (though for some it is $2) in points, that can be redeemed for cash or prizes. No prenotification email for this study was sent prior to field. Panelists receive a unique login to the survey and are only able to complete it one time. Non-responders were sent reminders to increase participation. The study was conducted in both English and Spanish. The full sample, pre screening, was weighted to adjust for gender by age, race/ethnicity, education, Census region, metropolitan status, household income, and party identification. The demographic benchmarks came from 2022 Current Population Survey (CPS) from the U.S. Census Bureau. Party ID benchmarks are from recent ABC News/Washington Post telephone polls. The weighting categories were as follows:
- Gender (Male, Female) by Age (18–29, 30–44, 45–59, and 60+)
- Race/Hispanic Ethnicity (White Non-Hispanic, Black Non-Hispanic, Other or 2+ Races Non-Hispanic, Hispanic)
- Education (High School graduate or less, Some College, Bachelor and beyond)
- Census Region (Northeast, Midwest, South, West)
- Metropolitan status (Metro, non-Metro)
- Household Income (Under $25,000, $25,000-$49,999, $50,000-$74,999, $75,000-$99,999, $100,000-$149,999, $150,000+)
- Party ID (Democrat, Republican, Independent, Something else)
No respondents were removed from the final data for refusing all of the survey items.
Washington, DC, November 7, 2023 – A new 538/Washington Post/Ipsos poll conducted in the week leading up to the third Republican presidential debate finds that former President Donald Trump continues to poll most favorably among likely Republican primary or caucus voters. His numbers remain similar to the lead-up to the previous two debates, as two-third of voters have a favorable opinion of Trump and are considering voting for him. While Republican candidates Ron DeSantis and Nikki Haley are the biggest challengers to the former president, they continue to remain a distant second and third, respectively.
The poll also finds that Republican voters are much more likely to support sending aid and additional military supplies to Israel than to Ukraine. However, a majority oppose the U.S. getting directly involved in either conflict. For 538's story, click here.
Detailed Findings:
- Former President Trump continues to poll most favorably among Republican primary voters.
- Two in three voters (66%) have a favorable opinion of Trump; just 31% views him unfavorably.
- Those with a high school diploma or less (78%) and those earning less than $50K a year (75%) hold more favorable views of Trump compared to those with a bachelor’s degree or higher (48%) and those earning more than $100K (59%).
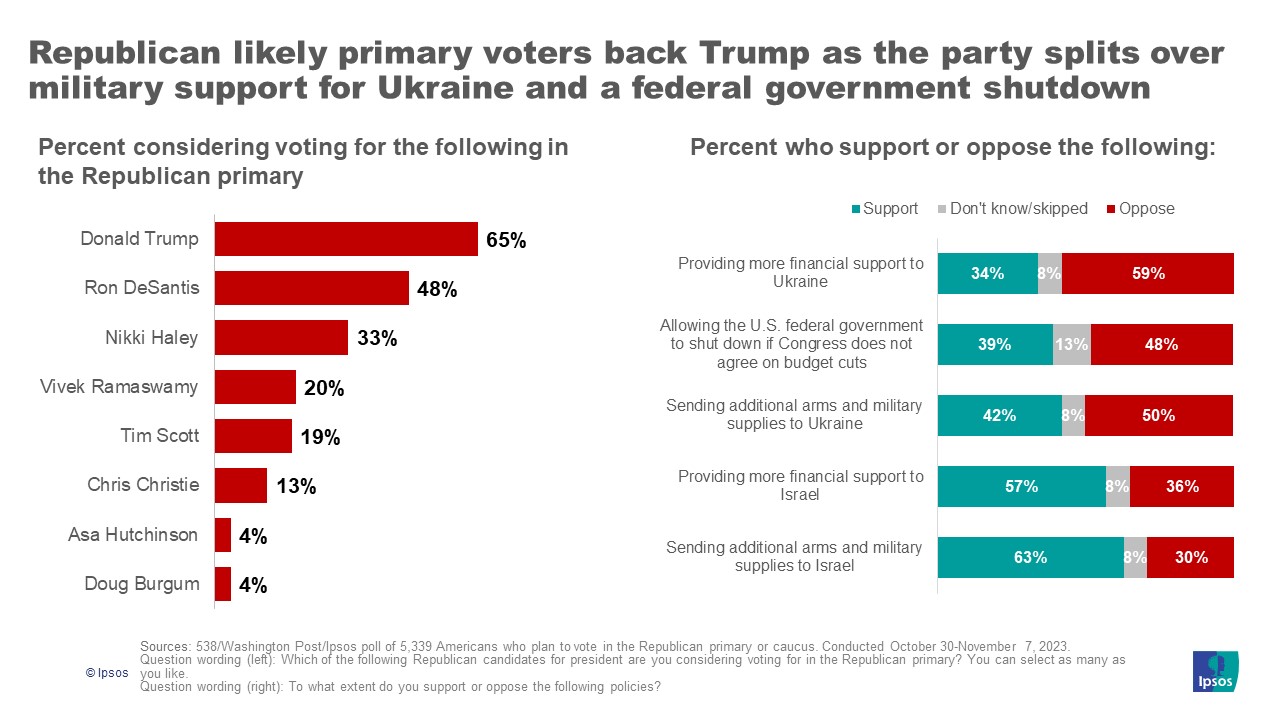
- Two-thirds of Republican primary voters are considering voting for Trump (65%). The same demographic trends hold true here, with non-college-educated and less affluent voters being more likely to be considering voting for the former president.
- A majority believe Trump is the best among the Republican presidential candidates in terms of being the strongest leader (56%) and having the best chance to and defeat Joe Biden in the general election (55%). A plurality also say he is most likely to unite the Republican party (34%).
- Ron DeSantis and Nikki Haley poll most favorably after Trump. However, all candidates remain distant second to the former president.
- Fifty-seven percent of voters have a favorable opinion of DeSantis, compared to 27% that view him unfavorably and 16% that have no opinion or have never heard of him. Forty-eight percent are considering voting for him.
- Forty-four percent of voters have a favorable opinion of Haley. While just 20% view her unfavorably, 35% have either no opinion or have not heard of her. Thirty-three percent are considering voting for her.
- No other candidate has a favorability rating above 40%.
- Among the third tier of candidates, around one in five are considering voting for Vivek Ramaswamy (20%) and Tim Scott (19%). Few Republican voters are considering voting for Chris Christie (13%), Doug Burgum (4%), or Asa Hutchinson (4%).
- Assuming they are not the Republican nominee, Republican primary voters are most likely to prefer Haley (22%) or DeSantis (19%) as the choice for Republican vice presidential nominee.
- Republican voters are more likely to support sending financial aid and military supplies to Israel than Ukraine. However, a majority oppose getting the U.S. military involved in either conflict.
- Nearly two in three voters (63%) support sending additional arms and military supplies to Israel, and 57% say the same of providing more financial support to Israel.
- There is significantly less support for sending additional military supplies (42%) and providing more financial support (34%) for Ukraine.
- In both cases, support is significantly higher among Americans ages 50 and older than those younger than 50.
- While support for aid differs by conflict, Republican voters are against the U.S. directly intervening in both cases. Three in four oppose sending troops to support Ukraine in fighting Russia (76%) and the U.S. launching airstrikes against Russia forces Ukraine (74%). Fewer, but a majority nonetheless, also oppose sending troops to support Israel in fighting Hamas (57%) and the U.S. launching airstrikes against Hamas in Gaza (52%).
- Nearly half of Republican voters oppose shutting down the government if Congress does not agree on budget cuts and withdrawing from the North Atlantic Treaty Organization (NATO).
- Just 39% support allowing the U.S. federal government to shut down if Congress does not agree on budget cuts, compared to 48% that oppose.
- Support for the government shutting down is much higher among men (49%) and those earning more than $100K (42%) than women (29%) and those earning less than $50K (35%).
- Similarly, 48% of Republican voters oppose the U.S. withdrawing from NATO, while just 26% support this policy. Americans under 35 are less likely to say they don’t know compared to their older counterparts.
About the Study
This 538/Washington Post/Ipsos poll was conducted October 30 to November 7, 2023, by Ipsos using the probability-based KnowledgePanel®. This poll is based on a nationally-representative probability sample of adults age 18 or older. Questions presented in this document were only asked of those who are likely to vote in the Republican primary or caucus (N=5,339).
The survey was conducted using KnowledgePanel, the largest and most well-established online probability-based panel that is representative of the adult U.S. population. Our recruitment process employs a scientifically developed addressed-based sampling methodology using the latest Delivery Sequence File of the USPS – a database with full coverage of all delivery points in the U.S. Households invited to join the panel are randomly selected from all available households in the U.S. Persons in the sampled households are invited to join and participate in the panel. Those selected who do not already have internet access are provided a tablet and internet connection at no cost to the panel member. Those who join the panel and who are selected to participate in a survey are sent a unique password-protected log-in used to complete surveys online. As a result of our recruitment and sampling methodologies, samples from KnowledgePanel cover all households regardless of their phone or internet status and findings can be reported with a margin of sampling error and projected to the general population. KnowledgePanel members receive a per survey incentive, usually the equivalent of $1 (though for some it is $2) in points, that can be redeemed for cash or prizes. No prenotification email for this study was sent prior to field. Panelists receive a unique login to the survey and are only able to complete it one time. Non-responders were sent reminders to increase participation.
The study was conducted in both English and Spanish. The full sample, pre screening, was weighted to adjust for gender by age, race/ethnicity, education, Census region, metropolitan status, household income, and party identification. The demographic benchmarks came from 2022 Current Population Survey (CPS) from the U.S. Census Bureau. Party ID benchmarks are from recent ABC News/Washington Post telephone polls. The weighting categories were as follows:
- Gender (Male, Female) by Age (18–29, 30–44, 45–59, and 60+)
- Race/Hispanic Ethnicity (White Non-Hispanic, Black Non-Hispanic, Other or 2+ Races Non-Hispanic, Hispanic)
- Education (High School graduate or less, Some College, Bachelor and beyond)
- Census Region (Northeast, Midwest, South, West)
- Metropolitan status (Metro, non-Metro)
- Household Income (Under $25,000, $25,000-$49,999, $50,000-$74,999, $75,000-$99,999, $100,000-$149,999, $150,000+)
- Party ID (Democrat, Republican, Independent, Something else)
Twenty-six respondents were removed from the final data for refusing all of the survey items.
The margin of sampling error among those likely to vote in the Republican primary or caucus is plus or minus 1.52 percentage points at the 95% confidence level. The margin of sampling error takes into account the design effect, which was 1.29. The margin of sampling error is higher and varies for results based on sub-samples. Sampling error is only one potential source of error. There may be other unmeasured non-sampling error in this or any poll. In our reporting of the findings, percentage points are rounded off to the nearest whole number. As a result, percentages in a given table column may total slightly higher or lower than 100%. In questions that permit multiple responses, columns may total substantially more than 100%, depending on the number of different responses offered by each respondent.
For more information on this news release, please contact:
Chris Jackson
Senior Vice President, US
Public Affairs
+1 202 420-2025
[email protected]
About Ipsos
Ipsos is one of the largest market research and polling companies globally, operating in 90 markets and employing over 18,000 people.
Our passionately curious research professionals, analysts and scientists have built unique multi-specialist capabilities that provide true understanding and powerful insights into the actions, opinions and motivations of citizens, consumers, patients, customers or employees. Our 75 solutions are based on primary data from our surveys, social media monitoring, and qualitative or observational techniques.
Our tagline "Game Changers" sums up our ambition to help our 5,000 customers move confidently through a rapidly changing world.
Founded in France in 1975, Ipsos has been listed on the Euronext Paris since July 1, 1999. The company is part of the SBF 120 and Mid-60 indices and is eligible for the Deferred Settlement Service (SRD).ISIN code FR0000073298, Reuters ISOS.PA, Bloomberg IPS:FP www.ipsos.com