What does the NHS Adult Inpatient Survey tell us about patient experiences, in the context of increased waiting times?
What is the Adult Inpatient Survey?
The Adult Inpatient Survey, commissioned by the Care Quality Commission (CQC), looks at the experiences of people aged 16 and over that have been an inpatient at an NHS hospital. The survey has been running since 2002 and is published annually. The survey also collects information about patients’ demographics (including characteristics protected by the Equality Act 2010, such as age, long-term condition, religion and ethnicity), in order to understand differences in care.
What do the results tell us?
Results from the survey show some changes in people’s experience of inpatient care compared with the 2021 surveys, although generally declines have been less pronounced than the changes between 2020 and 2021.
There has been a deterioration in experience across a number of areas, including the overall experience. Fewer patients are reporting highly positive scores when asked about their overall experience of inpatient care, with half (50%) rating their experience as a 9 or 10, down from 52% in 2021. Waiting times is an area that has also seen a marked decline in results, along with questions related to staffing levels, which will be explored in more detail in this blog.
Confidence and trust in doctors and nurses remain high, with 81% and 79% saying they ‘always’ had confidence and trust in doctors and nurses respectively. Although, there has been a small but significant decrease in trust in nurses – down 0.6 percentage points from 2021.
A new question this year asking to elective patients how they felt their health had changed whilst they were on a waiting list to attend hospital, found that 4 in 10 patients felt their health had deteriorated in this time period.
What has changed the most in the past year?
Most patients report positive inpatient experiences; however there has been an increase in negative experiences for a number of questions. Results for the following questions, with the most significant decline in results from 2021, reveal some key areas for improvement:
- Waiting times for admission to hospital: 39% of respondents who were on a waiting list or had a planned admission would have liked to have been admitted ‘a lot’ or ‘a bit sooner’ to hospital, compared with 35% in 2021.
- Waiting times to access a bed on a ward: Nearly 1 in 5 (18%) respondents felt they had to wait ‘far too long’ to get a bed on a ward after their admission, a significant increase from 15% in 2021.
- Perceptions of staffing levels: 52% of patients thought there were enough nurses on duty to care for them while in hospital, a significant decrease from 55% in 2021.
- Quality of information people received during their stay in hospital: 39% of patients reported that they were told something by a member of staff that was different to what they had been told by another member of staff, a significant increase from 37% in 2021.
- Accessing previously prescribed medication: 70% of patients who brought medication with them to hospital were able to take it when they needed to, a significant decrease from 72% in 2021. People with a disability and/or some specific long-term conditions (for example, dementia or Alzheimer’s, diabetes and/or a neurological condition) had a worse than average experience of this.
What does the survey tell us about different experiences of hospital care?
Data from the survey can be analysed to understand differences in experience between various subgroups of patients. The following infographic summarises the patient groups who had a more positive versus more negative experience, which are explored in more detail below.
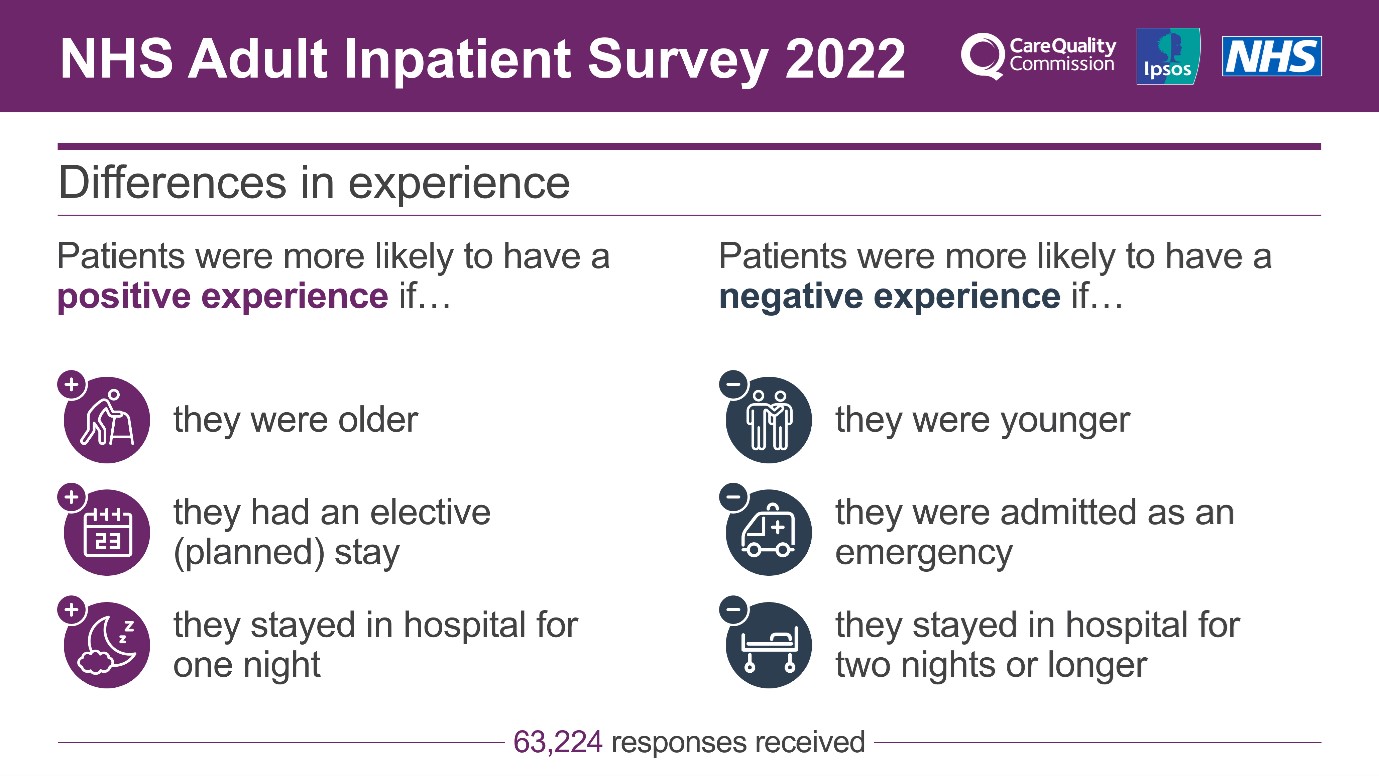
Route of admission and waiting times
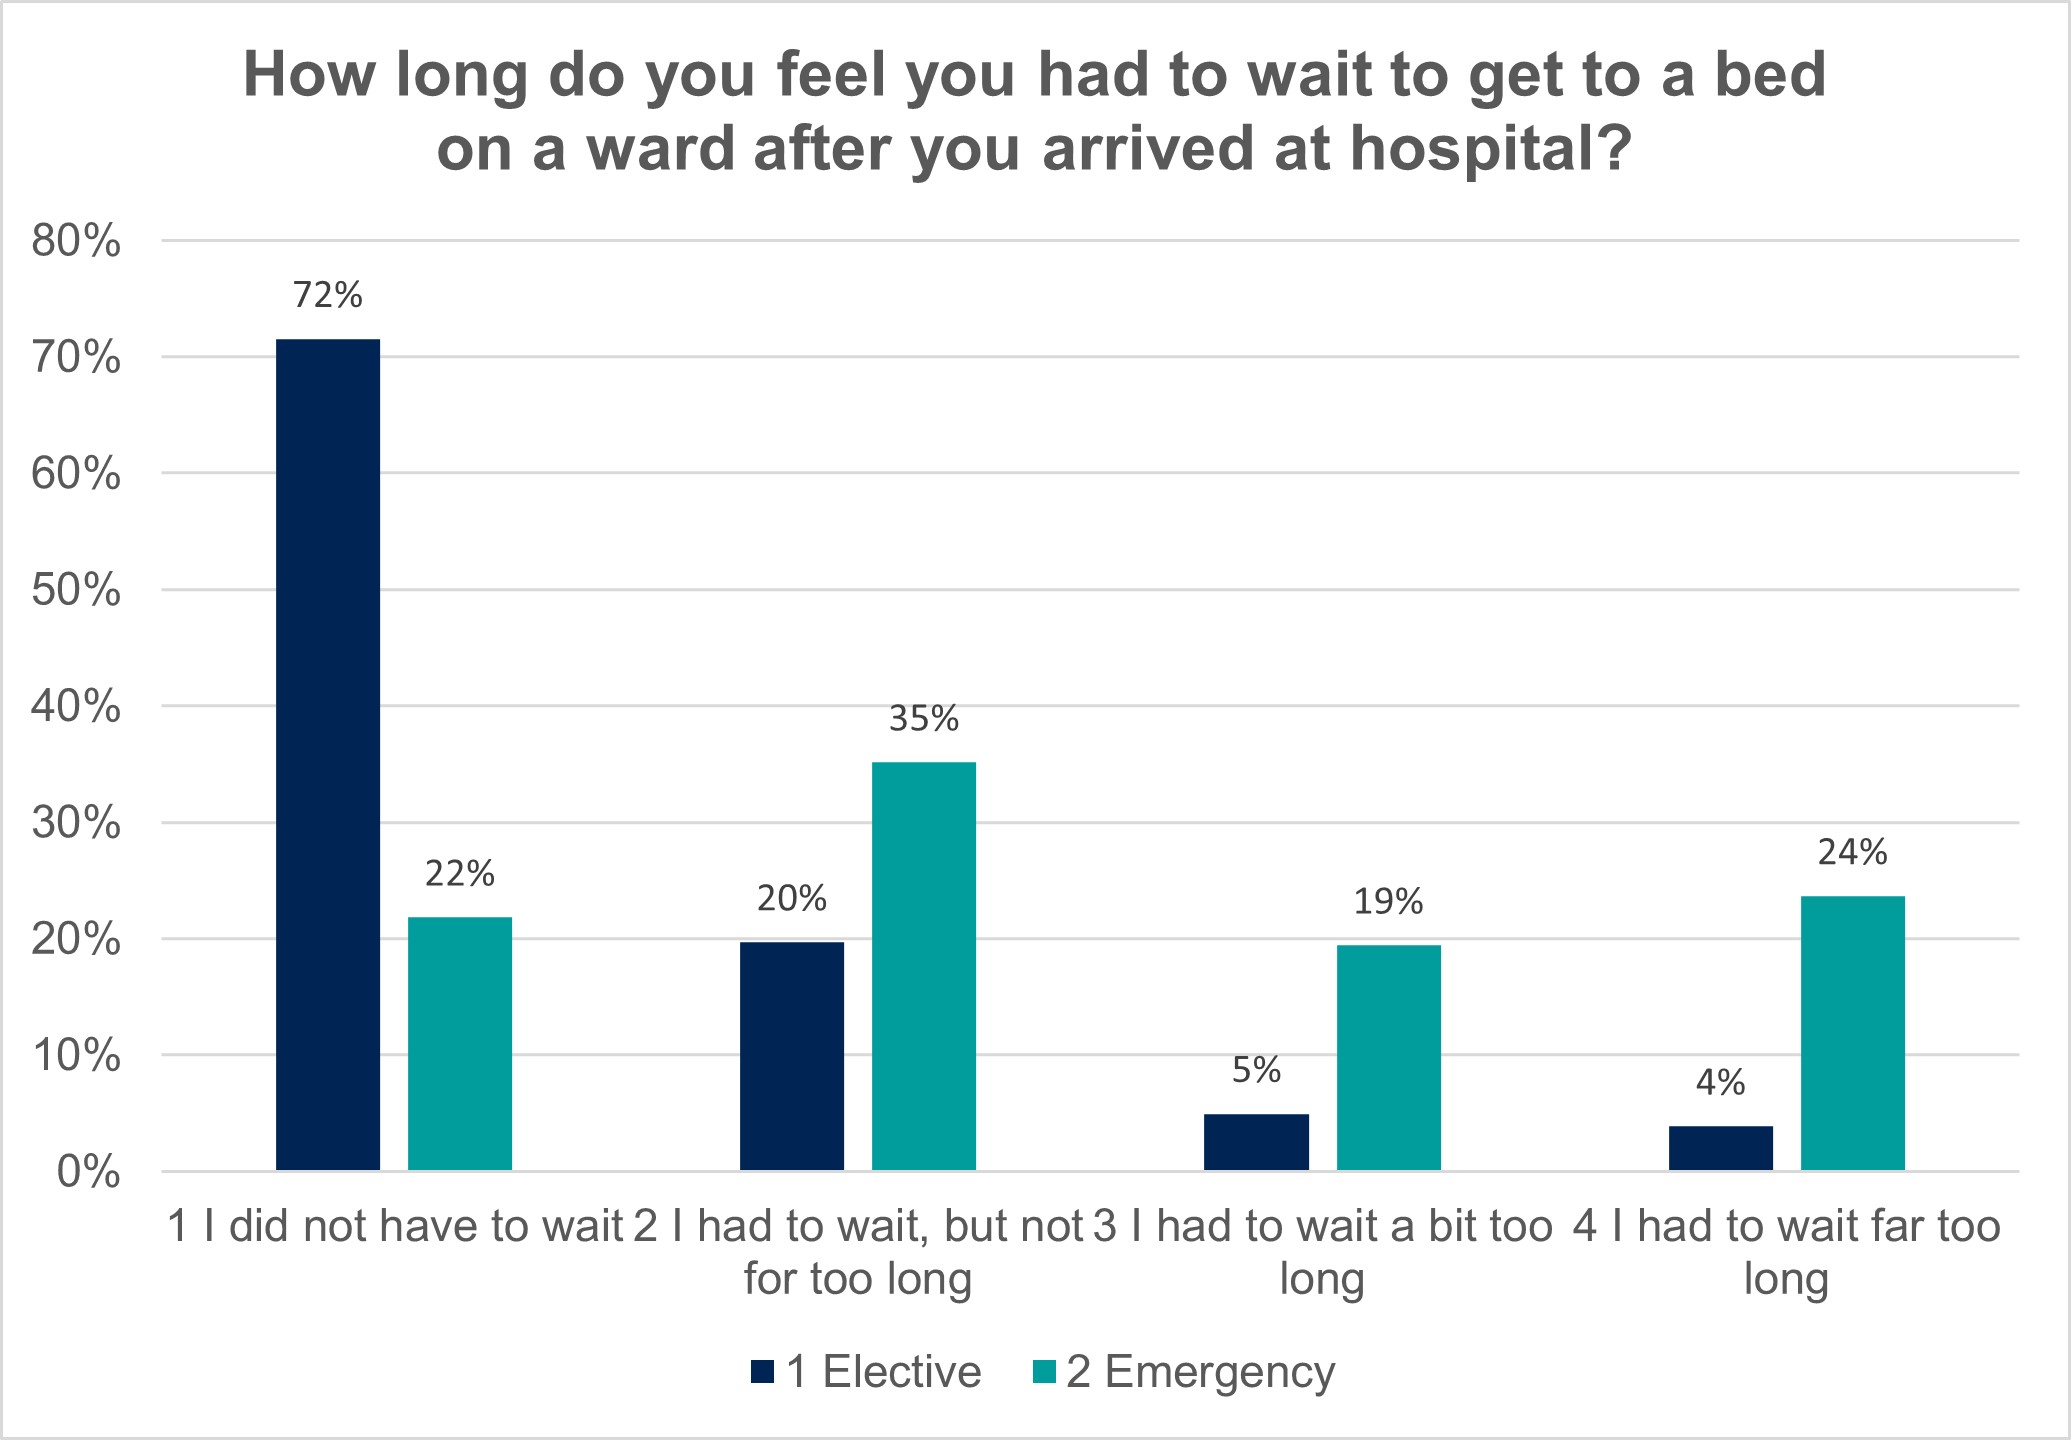
Patients who were admitted to inpatients services as an emergency (via A&E or an urgent treatment centre) reported poorer experiences than those who were admitted for elective (planned) care. This difference in experience is particularly prevalent in admission to hospital, where 43% of emergency patients felt they had to wait too long to get a bed on a ward after arriving at hospital compared with just 9% of elective patients. This is an increase from 37% in 2021 and 25% in 2020.
Emergency patients also had a worse than average experience across all of the other core questions included in the analysis. This includes trust in doctors and nurses, staff availability and reassurance, discussions on further care, being treated with respect and overall experience.
Waiting times were also an issue for patients who had planned admissions to hospital. There was a 4-percentage point significant increase from 2021 in elective patients who felt they would have liked to have been admitted to hospital sooner. Additionally, a new question this year found that four in 10 (41%) of elective patients felt their health deteriorated whilst on the waiting list to be admitted to hospital.
Age
Across all but one of the core questions included in analysis, younger people had a worse than average inpatient experience, compared with older patients. For example, patients aged 16-35 reported poorer experiences with getting help to wash, ability to take medicine, getting enough to drink, staff availability and reassurance, trust in doctors and nurses, receiving consistent information, involvement in care, involvement in discharge, discussions around further care, post-discharge care, being treated with respect, as well as a poorer overall experience in hospital.
People aged 36-50 similarly reported worse experiences across a similar list of the questions above, excluding help to wash, ability to take medicine, help to eat, involvement in care and involvement in discharge.
Conversely, patients aged 51 and over were more likely to report better experiences in these areas.
Length of stay in hospital
Patients who stayed in hospital for two nights or longer reported a poorer experience across a number of core questions included in the analysis. This includes ability to take medicine, help to wash, getting enough to drink, trust in nurses, receiving consistent information, involvement in care, staff availability and reassurance, involvement in discharge, discussions around further care and being treated with respect. In contrast, patients who only stayed in hospital for one night had a more positive experience in these areas.
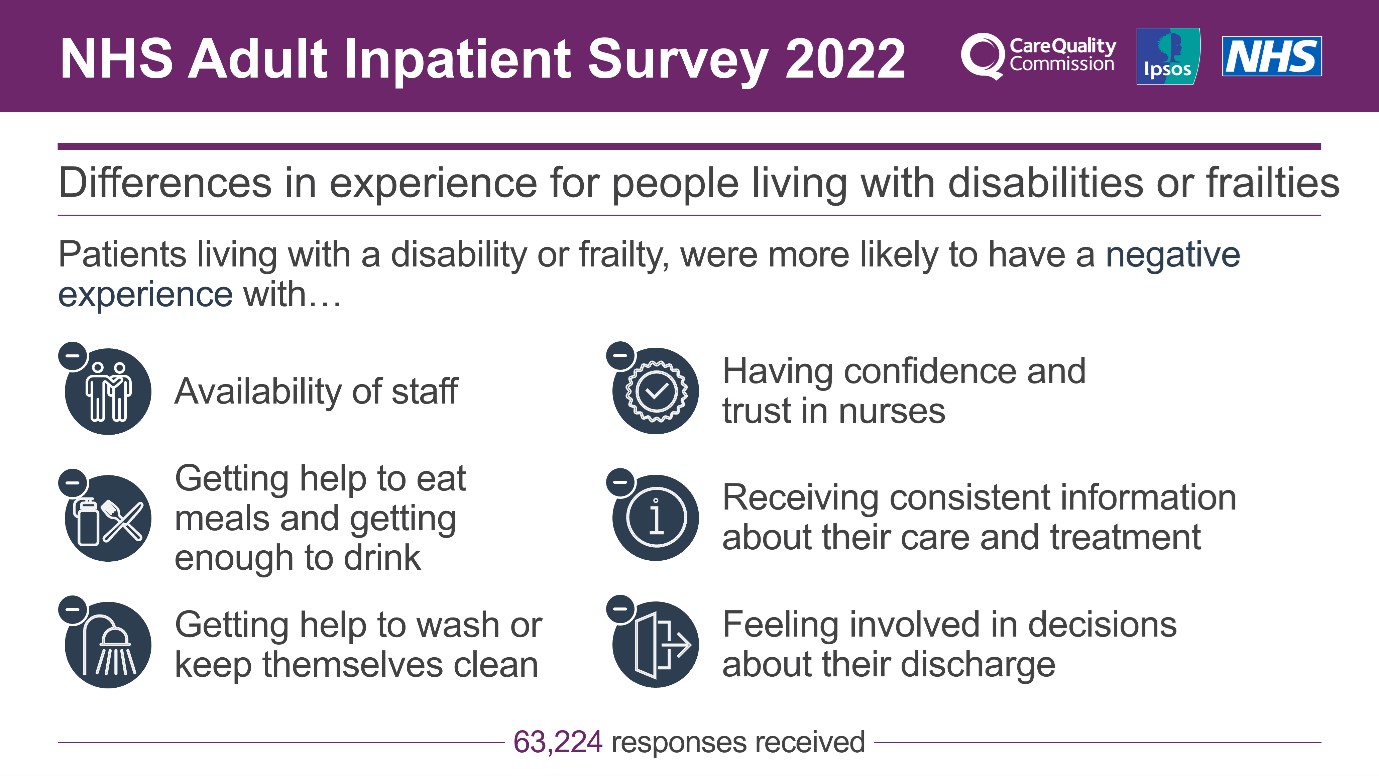
Frailty and disabilities
Patients living with a disability or are considered frail were more likely to have negative experiences across several questions that were analysed. In this analysis, people are considered frail if they have experienced two or more of the following: feeling isolated, two or more falls and mobility issues in the last 12 months. Patients considered frail had worse than average experiences in 15 theme areas, whilst people living with disabilities had poorer experiences across eight. Common theme areas for poorer experience in these subgroups were:
People with dementia
People with dementia or Alzheimer's were another group of patients that had poorer experiences across all but two of the core questions analysed, compared with people without dementia or Alzheimer’s. This includes getting help to wash and eat, ability to take medicine, getting enough to drink, trust in doctors and nurses, receiving consistent information, involvement in care, staff reassurance and availability, involvement in discharge, being treated with respect and overall experience.
Conclusion
This survey data provides useful insight into experience of patients in hospitals, with the backdrop of widespread publicity of expanding waiting lists and staff shortages. Despite the pressure hospitals are experiencing with a backlog of care and increasing waiting lists, the majority of patients continue to have an overall good experience in hospital (69% of patients rated their experience an 8, 9 or 10). Furthermore, 82% of patients felt they were always treated with respect and dignity, a figure consistent with 2021.
However, patient experience across many questions has continued to decline this year, though this has evened off after a more considerable decrease between 2020 and 2021. The pressure on the NHS is showing through in the data in relation to waiting times, alongside perceptions of staffing levels on wards.
There are particular groups that consistently are reporting poorer experiences, as outlined in this blog. This survey and other surveys that measure people’s experiences of care are vital for NHS Trusts to understand how they can improve their services to ensure all patients receive safe, effective and compassionate care.
More information can be found on the NHS Surveys website and the CQC website.
Technical note
Ipsos coordinates the Adult Inpatient Survey on behalf of the CQC. NHS trusts selected a sample of 1,250 patients, aged 16 or over, who had stayed at least one night in hospital during November 2022. The survey was conducted using a mixed methods approach, combining online and paper questionnaire modes. A total of 63,224 patients responded to the survey (an adjusted response rate of 40%) and fieldwork took place between January 2023 and April 2023.
More information on this analysis and the questions included can be found on the NHS Surveys website: https://nhssurveys.org/
Results for the Adult Inpatient 2022 survey are comparable with results from 2021 and 2020, but not with results from years prior to 2020 due to a change in survey methodology.
For each question in the survey, the individual responses are converted into scores on a scale of 1 to 10. A score of 10 represents the best possible result and a score of 0 the worst.
Further technical information and the full survey results can be found on the CQC website.


