What makes people happiest? Health, family, and purpose
What makes people happy in the age of COVID-19?
An Ipsos global survey run at the end of 2021, prior to the current war in Ukraine and at the beginning of the cost of living crisis, found that happiness amongst Britons had returned to pre-COVID levels, with 83% of people reporting to be very or rather happy (82% in 2019, prior to the pandemic). This is considerably higher than the global average of 67%, across 30 countries. Happiness is most prevalent in the Netherlands and Australia, with 86% and 85% respectively describing themselves as “very” or “rather” happy. China and Great Britain (both 83%), India (82%), France and Saudi Arabia (both 81%), and Canada (80%) follow.
At a global average level, the prevalence of happiness globally is now not only higher than it was in mid-2020, a few months into the COVID-19 pandemic, but also compared to mid-2019, months before the pandemic. However, it is 10 points lower than it was 10 years earlier, back in late 2011.
The survey finds that, across the world, people most look to their health and well-being (both physical and mental), their family (partner/spouse and children), and having a sense of purpose as what gives them “the greatest happiness.” Next come their living conditions, feeling safe and in control, being in nature, having a meaningful job, and having more money.
Some elements are more widely viewed as sources of happiness today than they were back in 2019, pre-pandemic. Drivers of happiness that have most gained in importance are “being forgiven”, “forgiving someone”, finding someone to be with” and, although only a minority of adults mention it as a source of any happiness, “spending time on social media”.
These are some of the findings of a survey of 20,504 adults under the age of 75 conducted between November 19 and December 3, 2021, on Ipsos’s Global Advisor online survey platform.
Where are people happier?
The happiest countries surveyed, i.e., those where more than three out of four adults report being very happy or rather happy are the Netherlands, Australia, China, Great Britain, India, Saudi Arabia, France, Canada, Sweden, and the United States. Only two countries show fewer than one in two adults saying they are happy: Argentina and Turkey.
On average across 30 countries, 15% report being very much so and 52% rather happy. Countries with the highest proportion of adults considering themselves as very happy are India (39%), Australia (30%), and Saudi Arabia (29%). Those with the highest prevalence of adults saying they are not happy at all are Turkey (18%), Argentina (14%), and Hungary (13%).
Changes in happiness levels
Averaging at 67% across the 30 countries, the prevalence of happiness is four percentage points higher than in July-August 2020 and three points higher than in May-June 2019. However, it has a long way to go to regain its level of 77% recorded both in November-December 2011 and in April-May 2013.
- Compared to mid-2020, the proportion of happy adults has increased by five percentage points or more in 11 countries, particularly in Peru (+22), Mexico (+19), Chile (+18), and Spain (+17) while it is down by five points or more in only two countries, Turkey (-17) and China (-10).
- Compared to mid-2019, it is up by five points or more in nine countries (most of all in Argentina and Malaysia)) and down by five points or more in four countries (Canada, Germany, Poland, and Turkey).
- Compared to 10 years earlier, it is down in most countries, but nowhere as much as in Turkey (-47) and, despite a notable uptick in the past two years, in Argentina (-20).
Sources of happiness in the COVID era
Among 31 potential sources of happiness, people across the world are most likely to say they derive “the greatest happiness” from:
- My physical health and well-being (cited by 54%)
- My mental health and well-being (cited by 53%)
- My relationship with their partner/spouse (49%)
- Feeling my life has meaning (49%)
- My children (48%)
- My living conditions (47%)
- My personal safety and security (46%)
- Feeling in control of my life (44%)
- Being in nature (43%)
- Having a meaningful job/employment (42%)
- Having more money (42%)
Each of these 11 sources ranks in the top 11 of most countries. However, some other sources of happiness stand out as being particularly important in just one or a handful of countries (where they make the top 5):
- My personal financial situation (France)
- My hobbies/interests (Japan)
- The amount of free time I have (Japan, South Korea)
- Finding someone to be with (China, Germany, Japan, and Russia)
- Being recognised as a successful person (India and Turkey)
- My spiritual or religious well-being (Malaysia and Saudi Arabia)
- The state of the economy (South Korea)
Compared to the last survey conducted before the pandemic (May-June 2019), the sources of happiness that have most gained in importance globally pertain to personal connections and spirituality:
- Being forgiven for something I did (+8 points)
- Finding someone to be with (+7)
- Forgiving someone for something they did (+6)
- Time spent on social media (+6)
- My religious or spiritual well-being (+5)
The following sources of happiness have also gained in importance over the last 10 years:
- Moving to another country (+10)
- My access to entertainment or sports (+6)
- Freedom to express my beliefs (+6)
- The amount of free time I have (+5)
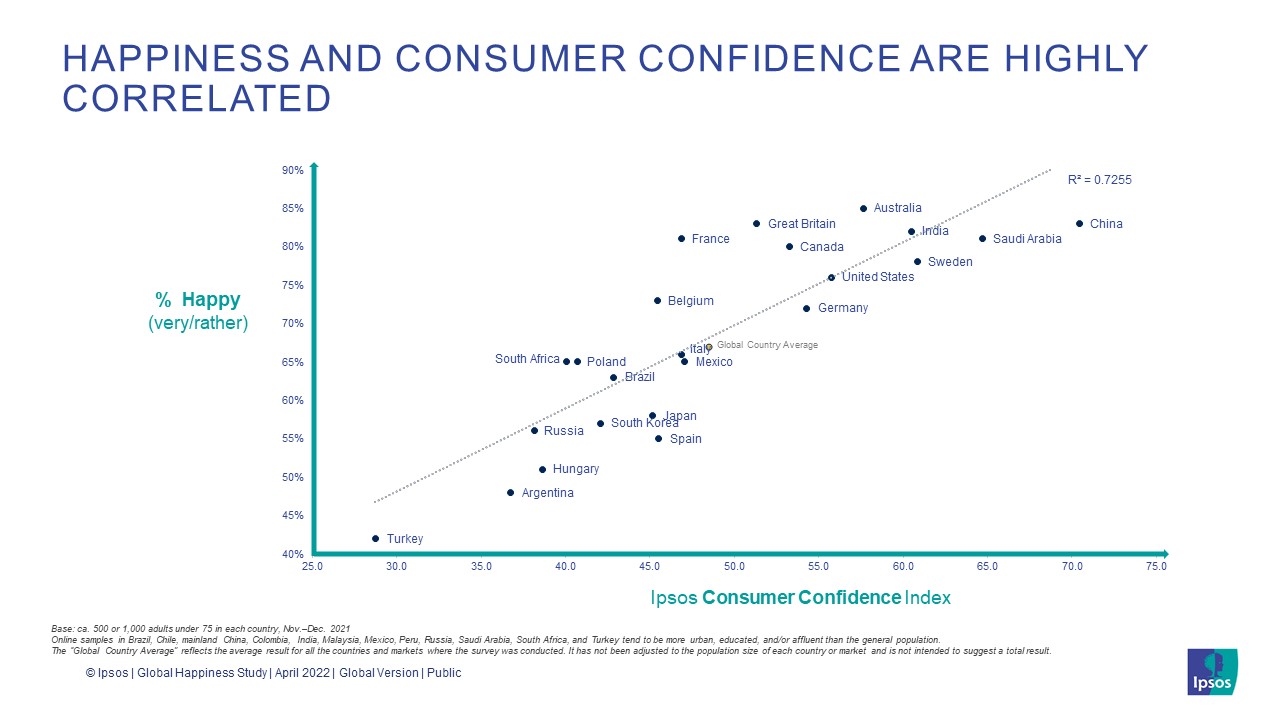
Happiness and consumer confidence
One of the main findings of the survey is the strong relationship between self-reported happiness and consumer confidence. Ipsos found a remarkably high level of correlation between the percentage of adults surveyed saying they are very or rather happy and the Ipsos Consumer Confidence Index in the same 23 countries – a coefficient of 0.73. The Consumer Confidence Index reflects consumers’ sentiment about their financial situation and purchasing comfort, the economy, jobs, and investment.
About the study
These are the findings of a 30-country Ipsos survey conducted November 19 – December 3, 2021, among 20,504 adults aged 18-74 in the United States, Canada, Malaysia, South Africa, and Turkey, 21-74 in Singapore, and 16-74 in 24 other countries, via Ipsos’s Global Advisor online survey platform.
Each country’s sample consists of 1000+ individuals in Australia, Brazil, Canada, China (mainland), France, Germany, Great Britain, Italy, Japan, Spain, and the United States, and 500+ individuals in Argentina, Belgium, Chile, Colombia, Hungary, India, Malaysia, Mexico, the Netherlands, Peru, Poland, Russia, Saudi Arabia, Singapore, South Africa, South Korea, Sweden, and Turkey.
The samples in Argentina, Australia, Belgium, Canada, France, Germany, Great Britain, Hungary, Italy, Japan, the Netherlands, Poland, South Korea, Spain, Sweden, Switzerland, and the United States can be taken as representative of these countries’ general adult population under the age of 75.
The samples in Brazil, Chile, China (mainland), Colombia, India, Malaysia, Mexico, Peru, Romania, Russia, Saudi Arabia, Singapore, South Africa, and Turkey are more urban, more educated, and/or more affluent than the general population. The survey results for these markets should be viewed as reflecting the views of the more “connected” segment of their population.
Prior fieldwork waves were also conducted on Ipsos’s Global Advisor online survey platform. The Aug 2020 wave was conducted Jul 24 – Aug 7, 2020, among 19,516 adults in 27 countries. The June 2019 wave was conducted May 24 - Jun 7, 2019, among 20,327 adults in 28 countries. The February 2018 wave was conducted Jan 26 - Feb 9, 2018, among 19,428 adults in 27 countries. The March 2017 wave was conducted Feb 17 - Mar 3, 2017, among 18,523 adults in 26 countries. The May 2013 wave was conducted May 7 - 21, 2013, among 18,513 adults in 25 countries. The Dec 2011 wave was conducted Dec 6 - 19, 2011, among 21,245 adults in 24 countries.
The data is weighted so that each market’s sample composition best reflects the demographic profile of the adult population according to the most recent census data.
The Global average reflects the average result of all the countries and markets where the survey was conducted that year. It has not been adjusted to the population size of each country or market and is not intended to suggest a total result.
Where results do not sum to 100 or the ‘difference’ appears to be +/-1 more/less than the actual, this may be due to rounding, multiple responses, or the exclusion of don't knows or not stated responses.
The precision of Ipsos online polls is calculated using a credibility interval with a poll of 1,000 accurate to +/- 3.5 percentage points and of 500 accurate to +/- 4.8 percentage points. For more information on Ipsos' use of credibility intervals, please visit the Ipsos website.
The publication of these findings abides by local rules and regulations.


