Where do the support for political parties stand?
The IEC, supported by some political parties, brought this application before the apex court due to the complications in organising local government elections in the middle of the Covid-19 pandemic. The Constitutional Court ruled that the elections should be scheduled between 27 October and 1 November 2021.
The court ruled that the IEC must comply with the Constitutional prescription that elections should be held within five years and ninety days of the date of the previous local government elections. The IEC has also been ordered to announce a date for a voter registration weekend within three days of the court’s ruling.
Although the IEC could still approach the Parliament of the Republic of South Africa and seek a postponement of the elections by amending the Constitution, this will require a two-thirds majority in Parliament, and it is uncertain if there will be enough support to delay the polls.
Approaching Parliament would probably limit the little time left to organise and formulate the logistics of this rather complex process. As there are 278 municipalities1 in South Africa, this essentially means that everything necessary to successfully organise and implement 278 mini-elections should be done in less than two months.
The national picture – uncertainty and a limited appetite for voting
On the ground very little campaigning has so far been done for these elections and it is difficult for political parties to organise meetings, rallies and all the other usual opportunities to speak to voters. The reasons are clear. Covid-19 restrictions limit the number of people who can get together in the same place.
But how do South African voters feel about these elections? There are around 39 million South Africans eligible to vote – i.e. 18 years or older, but not all of them are registered. In fact, less than 20 million voted in the last national election in 2019.
Will South Africans turn out to vote this time or will fear of Covid-19 keep them away? Or will those who want to vote now visit vaccination centres in droves?
In both the 2016 local government elections and the 2019 national and provincial elections, voter turnout was down from previous elections. So, is voter apathy still an issue?
Voters have expressed their discontent with politics and political parties in various ways over the last few years. Will this have an influence on voter turnout, or perhaps on the political parties themselves?
Traditionally the voter turnout in local government elections is lower compared to national and provincial elections – will this be the case again?
Ipsos has undertaken a CATI (Computer Assisted Telephone Interviewing) study from 16 to 20 August 2021, interviewing 1,501 randomly selected adults in the country about some of these issues2.
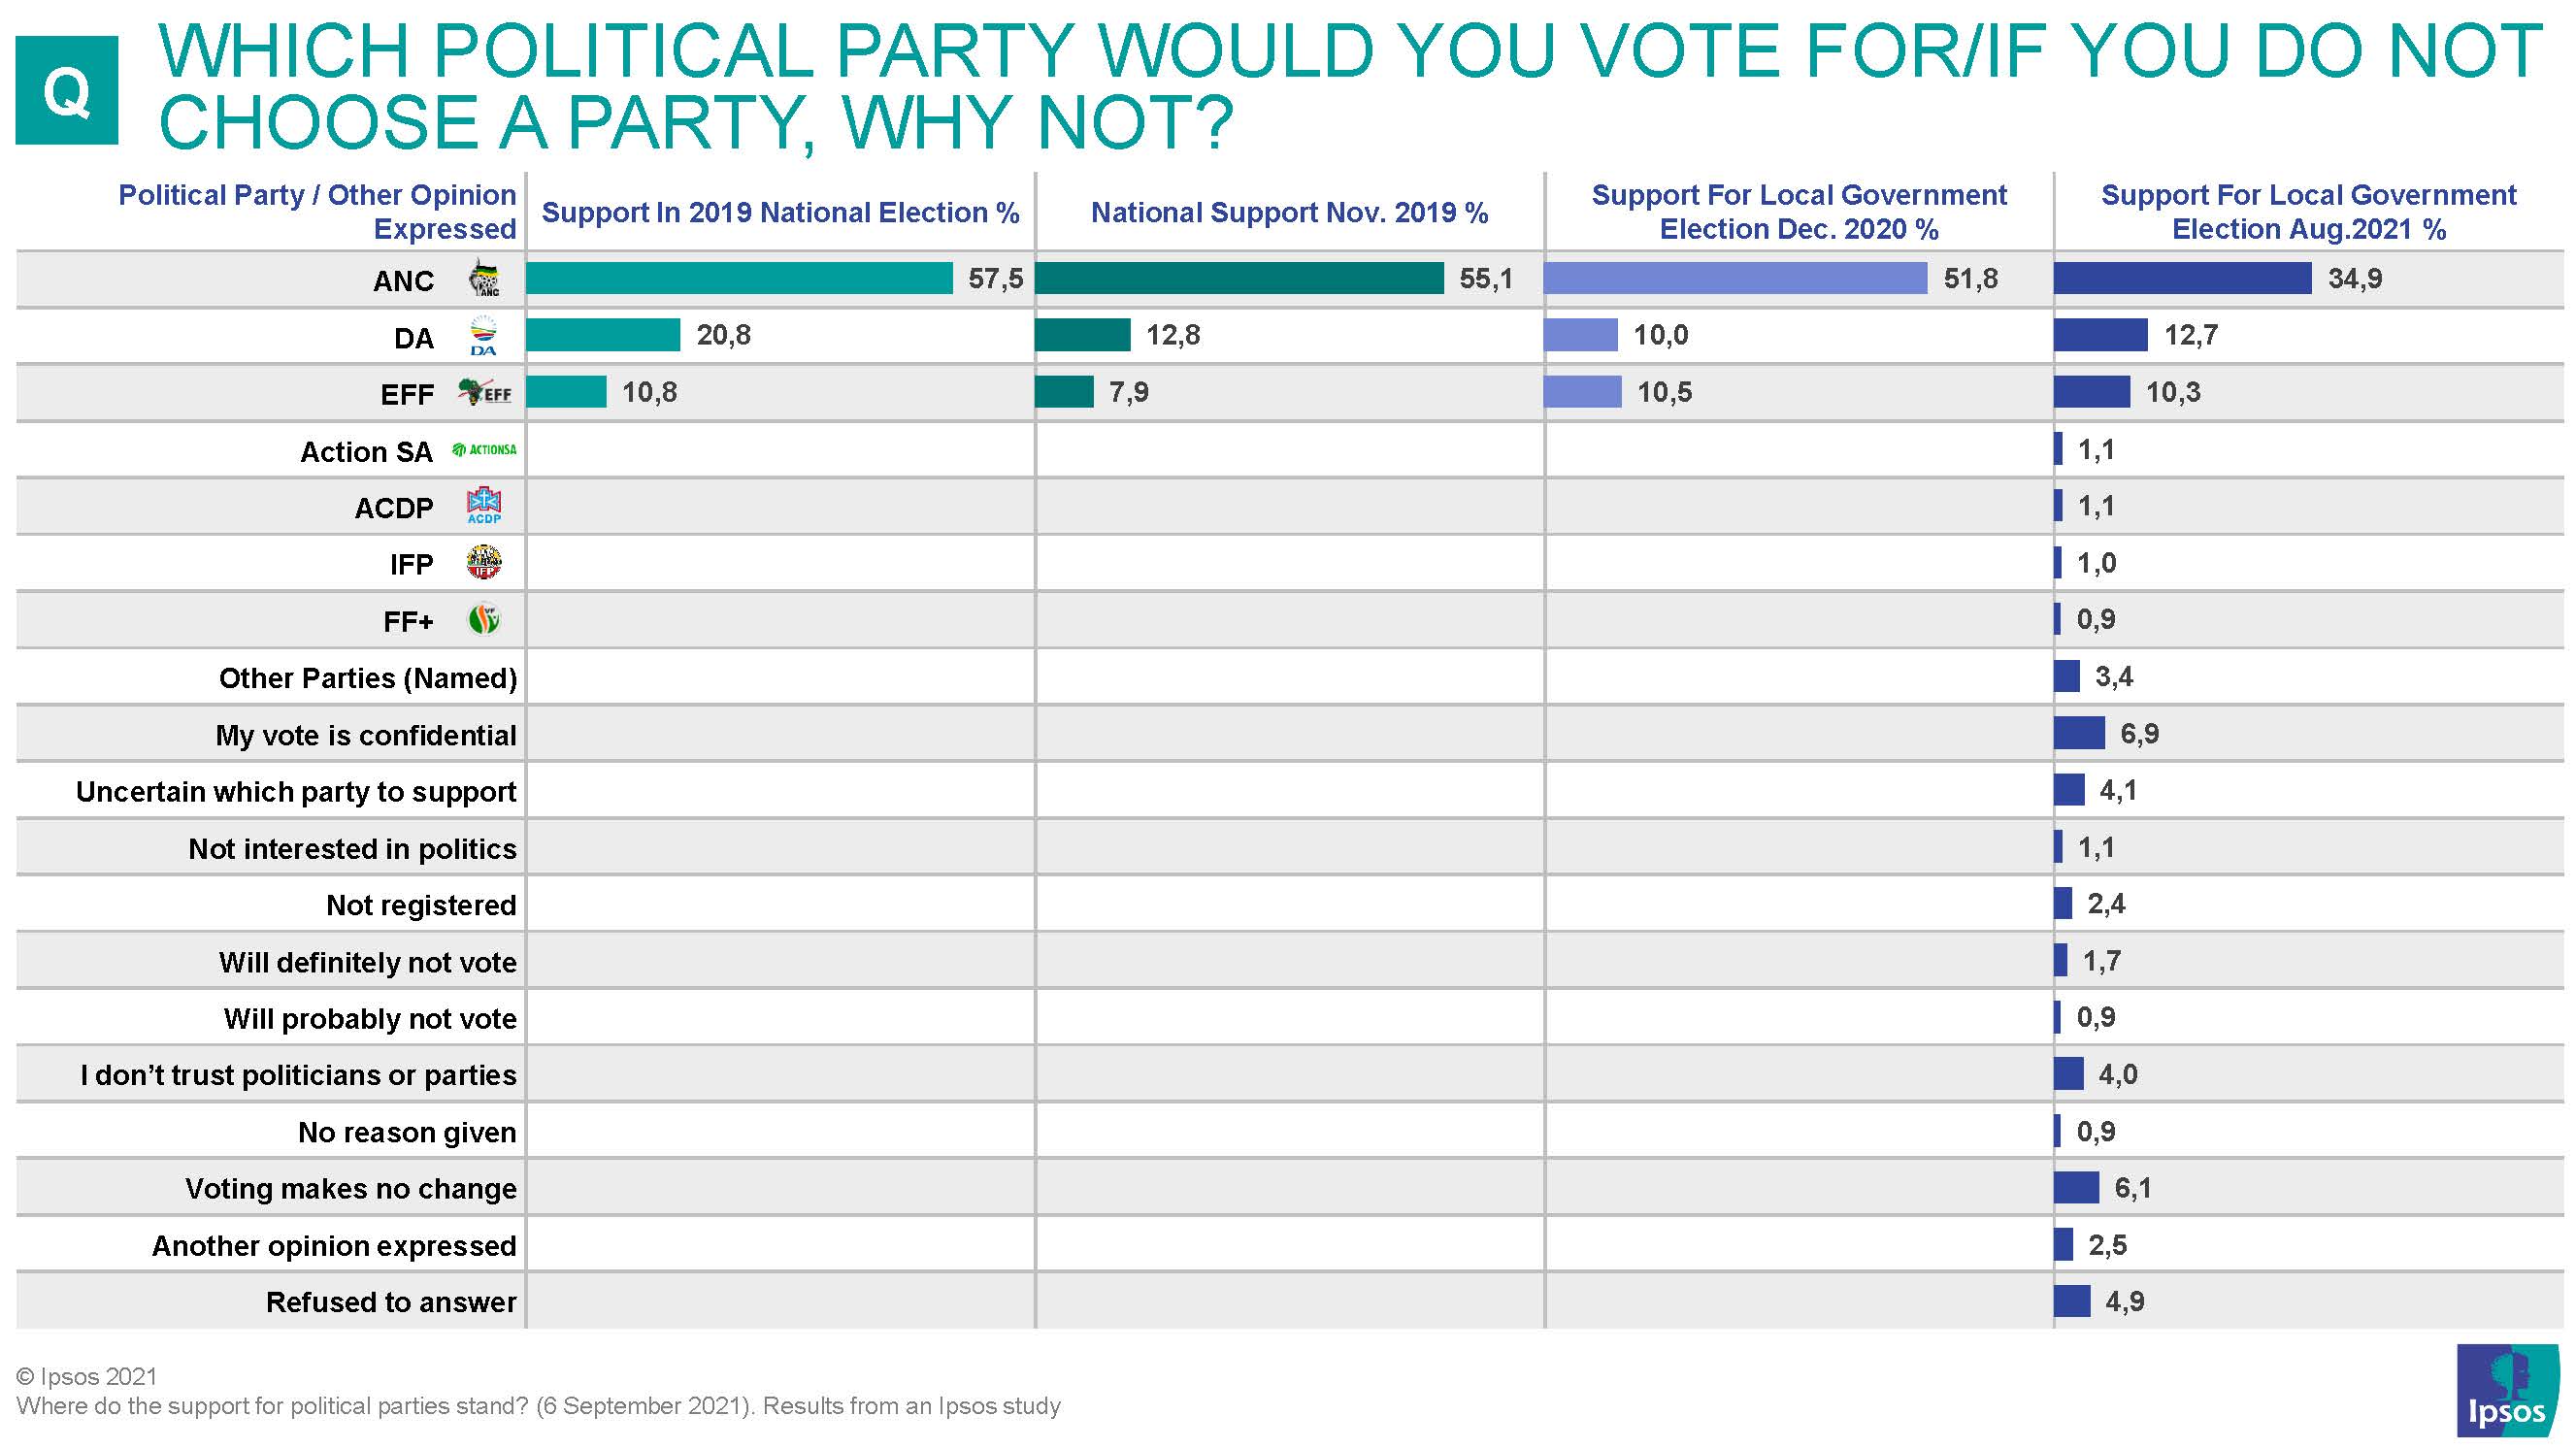
The table overleaf look at some comparisons over time:
- In the second column the support the three biggest parties achieved in the previous national election in 2019 is reflected (www.elections.org.za)
- In the third column support for the three biggest parties as measured by Ipsos in a face-to-face poll of 3,479 randomly selected individuals, representative of adults 18 years and older in November 2019 is reflected – asking respondents which party they would vote for in a national election (Ipsos Khayabus, Wave 3, November 2019)
- In the fourth column support for the three biggest parties as measured by Ipsos in a face-to-face poll of 3,469 randomly selected individuals, representative of adults 18 years and older in December 2020 is reflected – asking respondents which party they would vote for in a local government election (Ipsos Khayabus, Wave 2, December 2020), and
- In the fifth column support for all parties registering support of more than 1% in the poll conducted telephonically by Ipsos in August 2021 is reflected – asking respondents which party they would vote for in a local government election.
- If they did not choose a party, they were asked to give a reason for this (Ipsos CATI Snap Poll, August 2021).
Please note that this table shows results for ALL SOUTH AFRICANS 18 YEARS AND OLDER – it cannot in any way be construed as a possible prediction of the outcome of the local government elections.

This table shows a steady decline in support for the ANC in polls involving the total population eligible to vote since after the previous National Election in May 2019. Over the time of the three Ipsos studies mentioned, the DA and the EFF support stayed relatively constant, however, none of these two parties were threatening the position of the ANC as the most popular party in the country.
Some interesting reasons mentioned for not considering voting were3:
- “I have no interest in voting in local elections. I only vote in national elections.”
- “I will vote for whoever wants to do the job and run the country properly”
- “I will vote for any party, as long as it is not the ANC”
- “I’ll see who to vote for when I get to the polling station”
- “I am unemployed, why should I vote?”
A more realistic view – what if 7 out of every 10 turn out to vote?
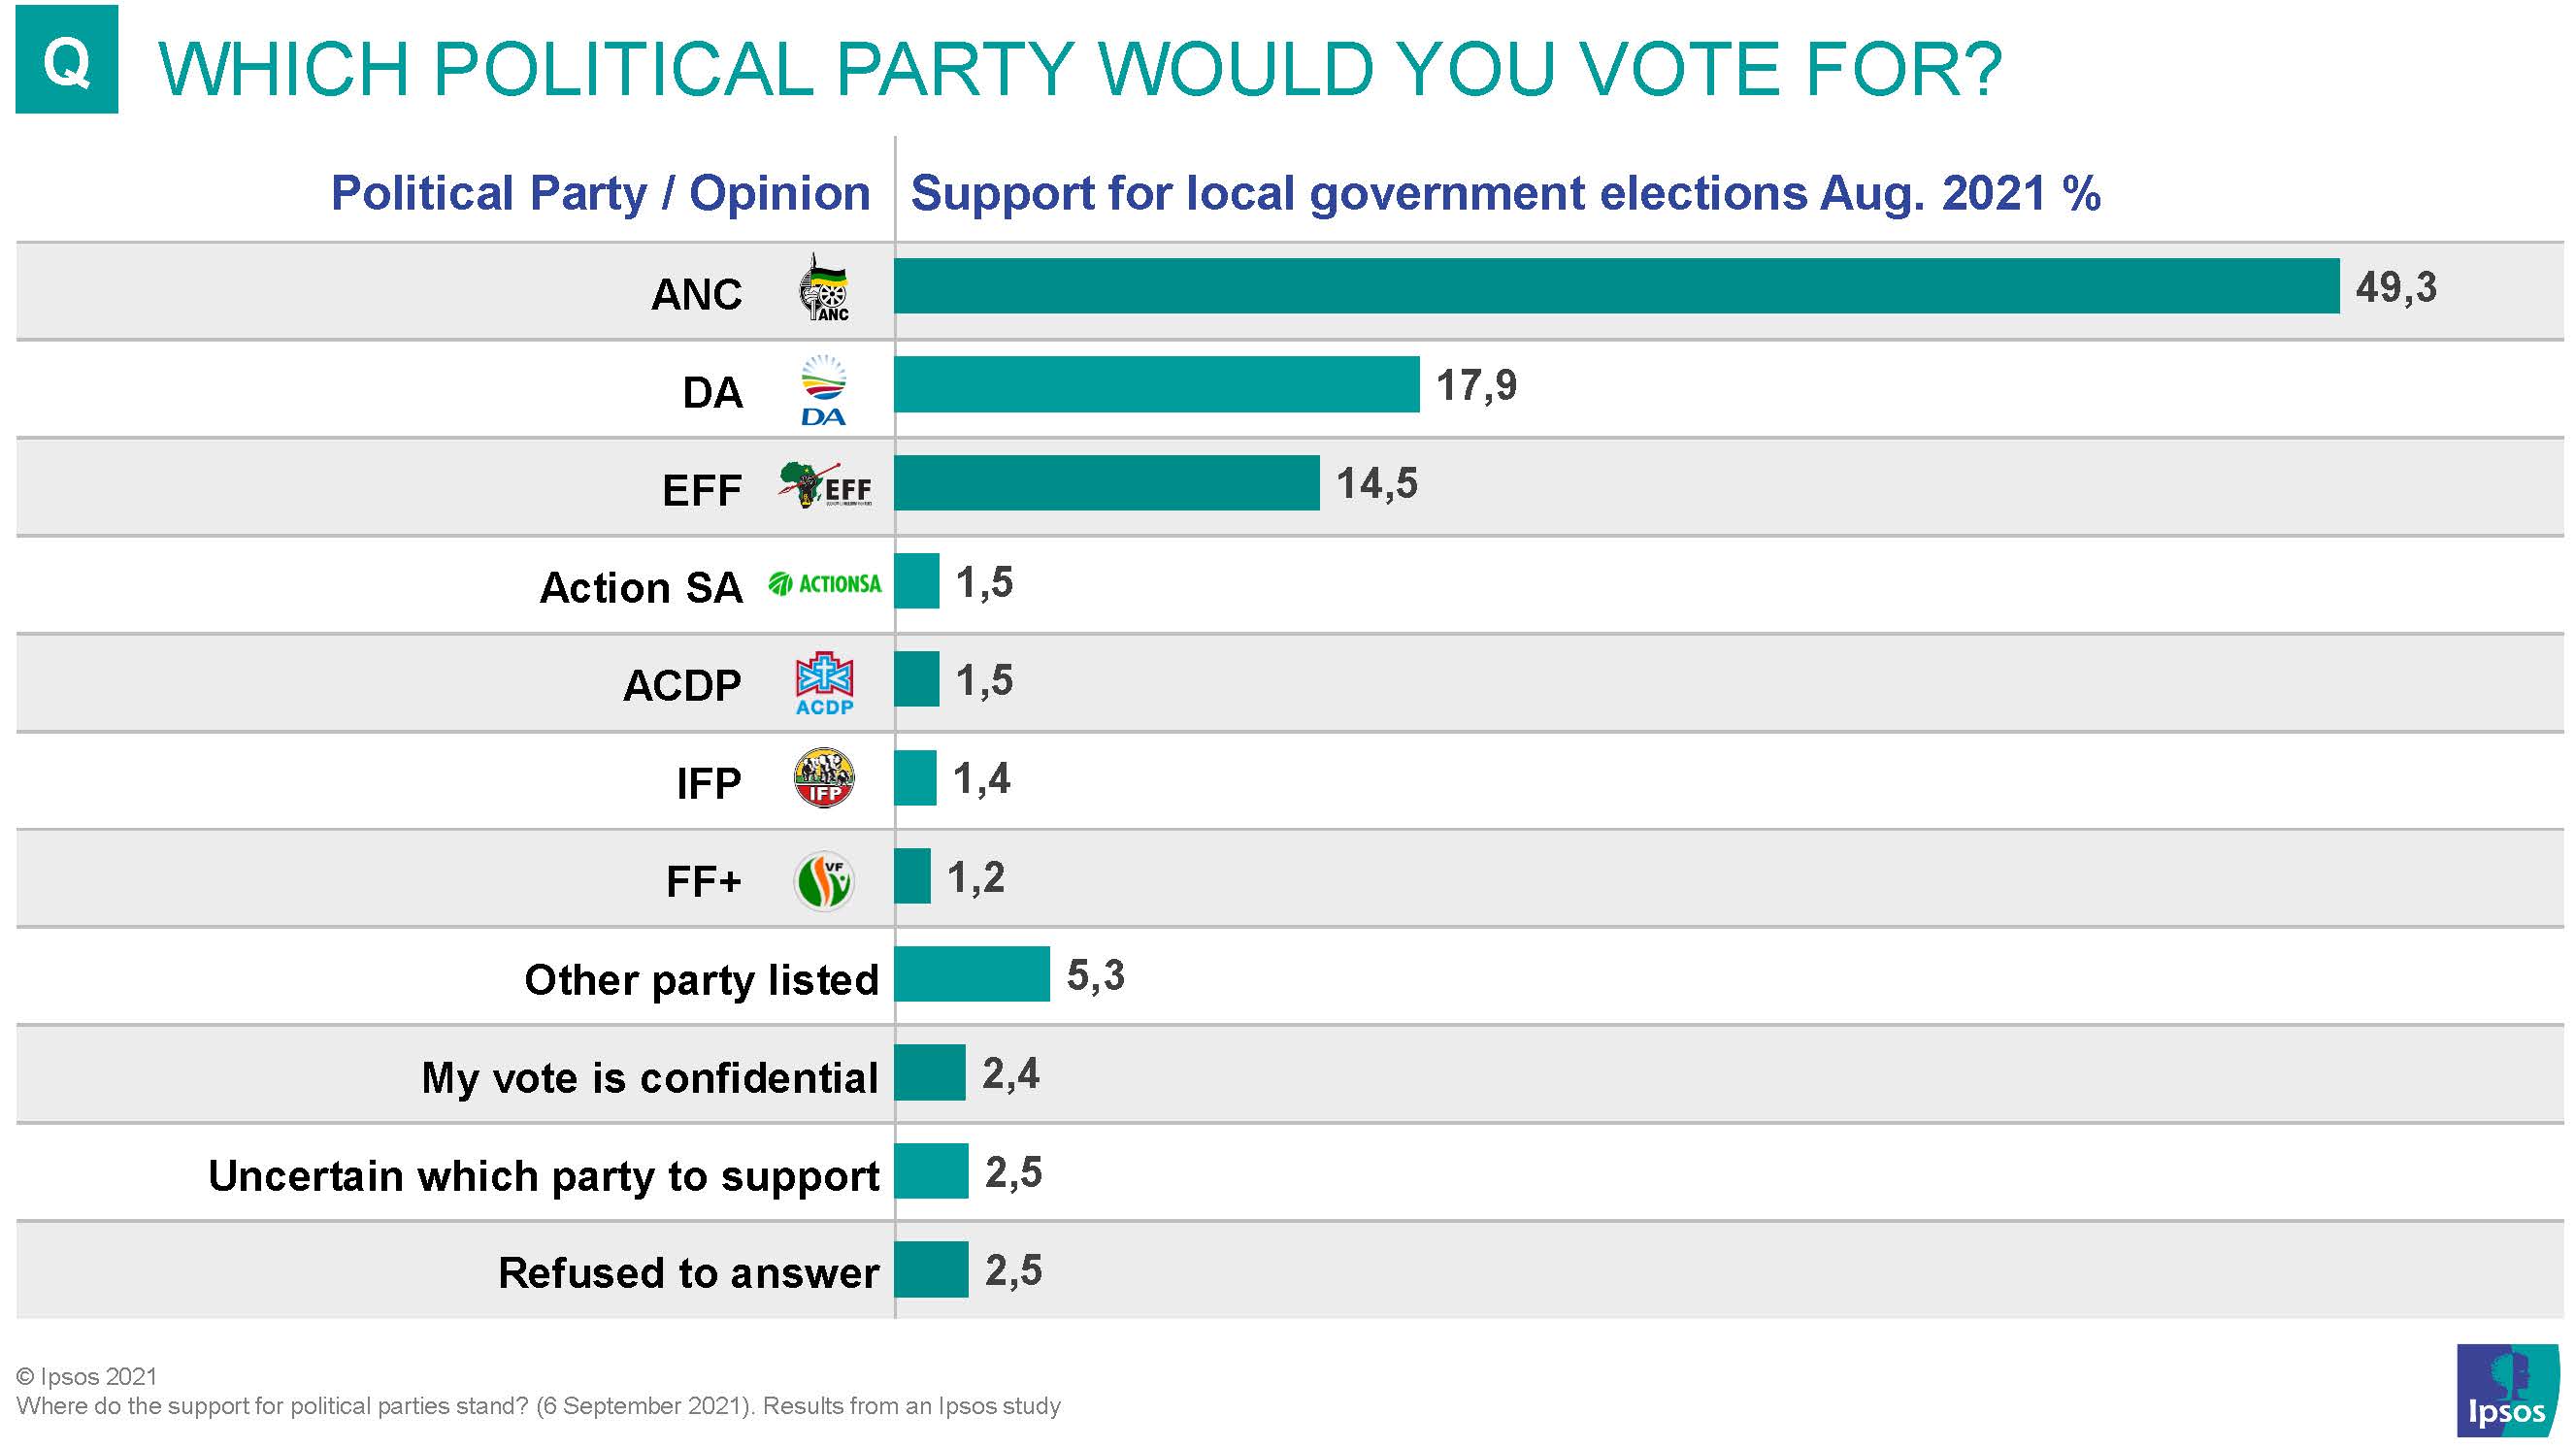
It is abundantly clear that not all eligible voters will vote in the local government elections at the end of October, so, “if there were a local government election tomorrow, which political party or organisation will you vote for?”
Seven in every ten (71%) have indicated that they would vote in the coming local government elections. The data suggest they would also support a wide variety of parties, as reflected in the graph below.
Countrywide almost half (49.3%) will draw a cross next to the name of the ANC, while the support for both the DA (17.9%) and the EFF (14.5%) respectively, is also in double figures. South Africa has a plethora of registered political parties, but very few of them currently garner more than one percent of support.

Please note that this is also not a prediction of the election, although a large proportion of voters have made up their minds, 7.4% of those who indicated that they will vote in the local government elections are not (yet) allocated to a political party. Predictions, for what they are worth, should only be made much closer to election day.
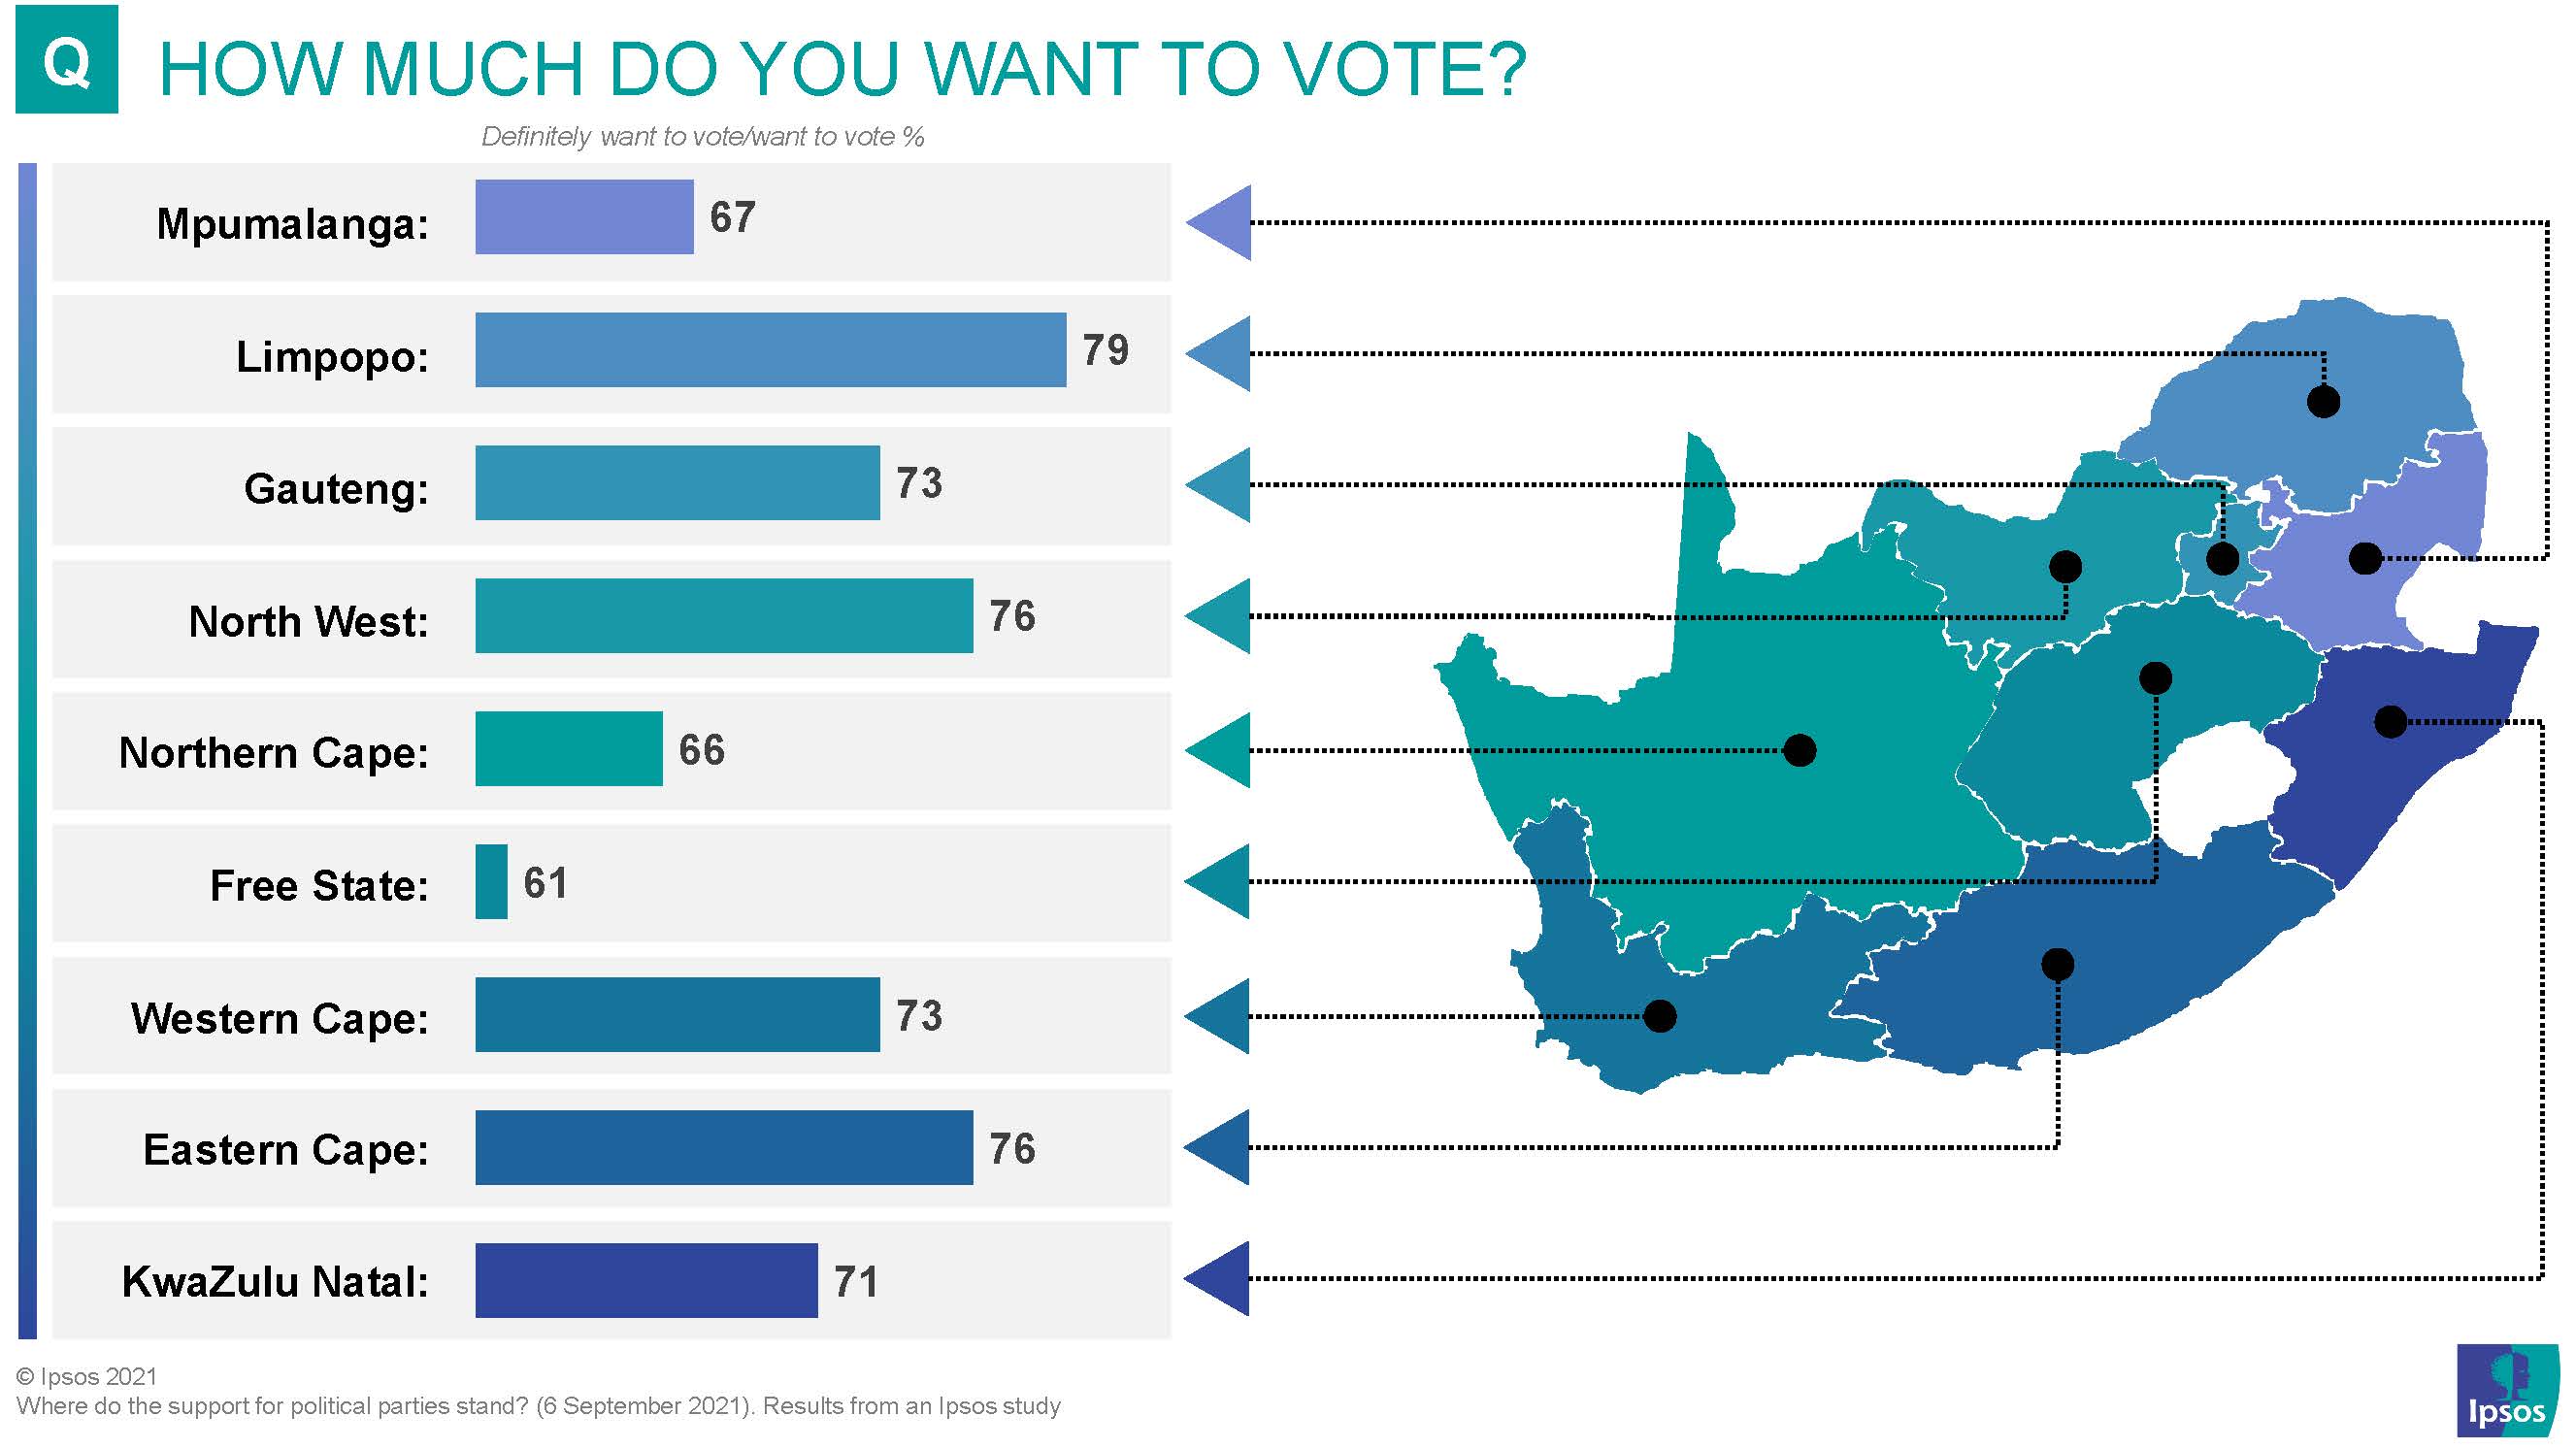
Who wants to vote?
Looking at those who indicated that they do want to vote in the local government elections, it is interesting that the more rural provinces of Limpopo, North West and the Eastern Cape top the list. And yet, metropolitan areas feature much more frequently in the travel plans of political leaders.
The Free State has experienced a lot of political turmoil since the last national election, very much like North West. It reacted totally differently with a much smaller proportion of voters wanting to participate in the local government elections.

1 8 Metropolitan municipalities, 44 District municipalities and 226 Local municipalities.
2 This “Snap Poll” was undertaken to measure the current support of political parties. 96% of South African have access to a mobile phone – enabling the collection of quality data in a relatively short period. Using a process called Random Digit Dialling, a computer dials randomly selected mobile phone numbers, and each person is interviewed personally over the phone. Results are representative of South Africans who are 18-75 years old and have access to a mobile phone.
3 Quoted verbatim
Technical detail
- Ipsos’ CATI centre interviewed 1,501 randomly chosen South Africans, from 18 to 75 years old from 16 to 20 August 2021. Respondents were selected by using a Random Digit Dialling (RDD) computer programme, in which the computer chooses possible mobile phone numbers and dialling these automatically for trained interviewers to conduct the interviews personally. This process delivers a sample that is representative of the 96% of South Africans who have access to mobile phones.
- The margin of error for this study depends on the sample size, response rate and on the random methodology used and at a 95% confidence level it will be from 1.1% (at a 95% or 5% response rate) to 2.53% (at a 50% response rate).

