Lloyds Spending Power Report
- Total interviews = 2070 (Male interviews = 1031, Female =1039)
- Participants aged 18-75
- Interviews conducted between 17th February – 27th February 2015
- Ipsos Omnibus Nationally representative sample
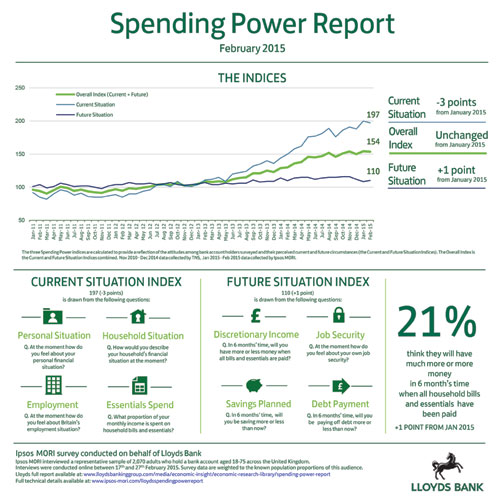
The three Spending Power indices are calculated to provide a reflection of the attitudes among bank account holders surveyed and their perceived current and future circumstances (the Current and Future Situation Indices).
Q1.Please tell us how you feel about the following things at the moment - your personal financial situation? Base (ALL)
| February (2070) | |
|---|---|
| Not good at all | 12% |
| Not good | 28% |
| Somewhat good | 47% |
| Very good | 12% |
| Excellent | 1% |
| Good (Net) | 60% |
| Not Good (Net) | 40% |
| NET difference | 21% |
Q2. How would you describe your household's financial situation at the moment? Base (ALL)
| February (2070) | |
|---|---|
| I/we live comfortably | 22% |
| I/we meet monthly bank/current account outgoings with some left over | 34% |
| I/we just meet monthly bank/current account outgoings-money is tight | 38% |
| I/we don't have enough to meet monthly bank/current account outgoings | 6% |
| Don't know | 1% |
| Feeling Comfortable (Net) | 56% |
| Feeling Short (Net) | 44% |
| NET difference | 12% |
Q1. Please tell us how you feel about the following things at the moment-Britain's employment situation? Base (ALL)
| February (2070) | |
|---|---|
| Not good at all | 15% |
| Not good | 42% |
| Somewhat good | 36% |
| Very good | 6% |
| Excellent | 1% |
| Good (Net) | 43% |
| Not Good (Net) | 57% |
| NET difference | -14% |
Q3. We want to understand what proportion of your monthly income is spent on household bills and essentials. Is it..? Base (ALL)
| February (2070) | |
|---|---|
| All of it | 14% |
| About three quarters of it | 43% |
| About half of it | 24% |
| About a quarter of it | 8% |
| Less than a quarter of it | 3% |
| Don't know | 3% |
| Not applicable | 3% |
| Do not have income | 2% |
| Net difference | -22% |
Q9. In six months' time, do you see yourself having more or less money when all household bills and essentials have been paid? Compared to what you have now, would you expect to have..? Base (ALL)
| February (2070) | |
|---|---|
| Much less money | 4% |
| Less money | 14% |
| The same money | 57% |
| More money | 19% |
| Much more money | 2% |
| Don't know | 4% |
| More money (Net) | 21% |
| Less money (Net) | 18% |
| NET difference | 4% |
Q1. Please tell us how you feel about the following things at the moment - your own job security? Base (All working)
| February (2070) | |
|---|---|
| Not good at all | 5% |
| Not good | 16% |
| Somewhat good | 46% |
| Very good | 25% |
| Excellent | 8% |
| Good (Net) | 79% |
| Not Good (Net) | 21% |
| NET difference | 58% |
Q11. Do you think that in six months' time you will save..? Base (ALL)
| February (2070) | |
|---|---|
| A lot less than now | 5% |
| Somewhat less than now | 8% |
| No change | 61% |
| Somewhat more than now | 18% |
| Much more than now | 4% |
| Don't know | 4% |
| Net More | 22% |
| Net Less | 14% |
| Net Difference | 8% |
Q11. Do you think that in six months' time you will pay off debt..? Base (ALL)
| February (2070) | |
|---|---|
| A lot less than now | 3% |
| Somewhat less than now | 6% |
| No change | 47% |
| Somewhat more than now | 9% |
| Much more than now | 2% |
| Don't know | 3% |
| Not applicable | 30% |
| Net More | 11% |
| Net Less | 9% |
| Net Difference | 3% |
Technical details:
- The three Spending Power indices are calculated to provide a reflection of the attitudes among bank account holders surveyed and their perceived current and future circumstances (the Current and Future Situation Indices).
- The Overall Index is the Current and Future Situation Indices combined.
- Nov 2010 - Dec 2014 data collected by TNS, Jan 2015 - Feb 2015 data collected by Ipsos.
- Ipsos interviewed a representative sample of 2,070 adults in February who hold a bank account aged 18-75, across the United Kingdom.
- For each survey c. 2,000 interviews were conducted online
- Where results do not sum to 100, this may be due to computer rounding, multiple responses or the exclusion of don't know/not stated answers.
- All interviews were conducted online and survey data are weighted to the known population proportions of this audience, by age, gender, region, working status and social grade.
For a fuller explanation of how the indices are calculated please click here.